|
1300
|
Is it possible to cancel or discard the values during validation
METHOD OCX_Exontrol1ValidateValue(Item, ColIndex, NewValue, Cancel) CLASS MainDialog
	// ValidateValue event - Occurs before user changes the cell's value.
	OutputDebugString(String2Psz( "ValidateValue" ))
	OutputDebugString(String2Psz( AsString(NewValue) ))
	OutputDebugString(String2Psz( "Change the Cancel parameter for ValidateValue event to accept/decline the newly value. " ))
	OutputDebugString(String2Psz( "The DiscardValidateValue restores back the previously values." ))
	oDCOCX_Exontrol1:DiscardValidateValue()
RETURN NIL

local var_Items as IItems

oDCOCX_Exontrol1:BeginUpdate()
oDCOCX_Exontrol1:Chart:[PaneWidth,true] := 0
oDCOCX_Exontrol1:CauseValidateValue := exValidateCell
IColumn{oDCOCX_Exontrol1:Columns:Add("Date")}:Editor:EditType := DateType
IColumn{oDCOCX_Exontrol1:Columns:Add("Text")}:Editor:EditType := EditType
var_Items := oDCOCX_Exontrol1:Items
	var_Items:[CellValue,var_Items:AddItem(SToD("20010101")),1] := "text"
	var_Items:[CellValue,var_Items:AddItem(SToD("20010101")),1] := "text"
	var_Items:[CellValue,var_Items:AddItem(SToD("20010101")),1] := "text"
	var_Items:[CellValue,var_Items:AddItem(SToD("20010101")),1] := "text"
	var_Items:[CellValue,var_Items:AddItem(SToD("20010101")),1] := "text"
oDCOCX_Exontrol1:EndUpdate()
|
|
1299
|
Is it possible to validate the values of the cells only when user leaves the focused item
METHOD OCX_Exontrol1ValidateValue(Item, ColIndex, NewValue, Cancel) CLASS MainDialog
	// ValidateValue event - Occurs before user changes the cell's value.
	OutputDebugString(String2Psz( "ValidateValue" ))
	OutputDebugString(String2Psz( AsString(NewValue) ))
	OutputDebugString(String2Psz( "Change the Cancel parameter for ValidateValue event to accept/decline the newly value. " ))
	Cancel := true
	OutputDebugString(String2Psz( "You can not leave the item/record until the Cancel is False." ))
RETURN NIL

local var_Items as IItems

oDCOCX_Exontrol1:BeginUpdate()
oDCOCX_Exontrol1:Chart:[PaneWidth,true] := 0
oDCOCX_Exontrol1:CauseValidateValue := exValidateItem
IColumn{oDCOCX_Exontrol1:Columns:Add("Date")}:Editor:EditType := DateType
IColumn{oDCOCX_Exontrol1:Columns:Add("Text")}:Editor:EditType := EditType
var_Items := oDCOCX_Exontrol1:Items
	var_Items:[CellValue,var_Items:AddItem(SToD("20010101")),1] := "text"
	var_Items:[CellValue,var_Items:AddItem(SToD("20010101")),1] := "text"
	var_Items:[CellValue,var_Items:AddItem(SToD("20010101")),1] := "text"
	var_Items:[CellValue,var_Items:AddItem(SToD("20010101")),1] := "text"
	var_Items:[CellValue,var_Items:AddItem(SToD("20010101")),1] := "text"
oDCOCX_Exontrol1:EndUpdate()
|
|
1298
|
We would like to validate the values of the cells. Is it possible
METHOD OCX_Exontrol1ValidateValue(Item, ColIndex, NewValue, Cancel) CLASS MainDialog
	// ValidateValue event - Occurs before user changes the cell's value.
	OutputDebugString(String2Psz( "ValidateValue" ))
	OutputDebugString(String2Psz( AsString(NewValue) ))
	OutputDebugString(String2Psz( "Change the Cancel parameter for ValidateValue event to accept/decline the newly value." ))
	Cancel := true
	OutputDebugString(String2Psz( "You can not leave the cell until the Cancel is False." ))
RETURN NIL

local var_Items as IItems

oDCOCX_Exontrol1:BeginUpdate()
oDCOCX_Exontrol1:Chart:[PaneWidth,true] := 0
oDCOCX_Exontrol1:CauseValidateValue := exValidateCell
IColumn{oDCOCX_Exontrol1:Columns:Add("Date")}:Editor:EditType := DateType
IColumn{oDCOCX_Exontrol1:Columns:Add("Text")}:Editor:EditType := EditType
var_Items := oDCOCX_Exontrol1:Items
	var_Items:[CellValue,var_Items:AddItem(SToD("20010101")),1] := "text"
	var_Items:[CellValue,var_Items:AddItem(SToD("20010101")),1] := "text"
	var_Items:[CellValue,var_Items:AddItem(SToD("20010101")),1] := "text"
	var_Items:[CellValue,var_Items:AddItem(SToD("20010101")),1] := "text"
	var_Items:[CellValue,var_Items:AddItem(SToD("20010101")),1] := "text"
oDCOCX_Exontrol1:EndUpdate()
|
|
1297
|
Is there any way to add auto-numbering
local var_Column as IColumn
local var_Columns as IColumns
local var_Items as IItems

var_Columns := oDCOCX_Exontrol1:Columns
	var_Columns:Add("Items")
	var_Column := IColumn{var_Columns:Add("Pos")}
		var_Column:FormatColumn := "1 pos ''"
		var_Column:Position := 0
var_Items := oDCOCX_Exontrol1:Items
	var_Items:AddItem("Item 1")
	var_Items:AddItem("Item 2")
	var_Items:AddItem("Item 3")
|
|
1296
|
How can I format my column to display the percent values �5,00%�
local var_Items as IItems

IColumn{oDCOCX_Exontrol1:Columns:Add("Percent")}:FormatColumn := "((dbl(value) * 100) format '2|,|3.')+'%'"
var_Items := oDCOCX_Exontrol1:Items
	var_Items:AddItem(0.5)
	var_Items:AddItem(0.4)
	var_Items:AddItem(0.75)
|
|
1295
|
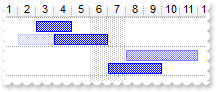
I can't control bar's transparency if the bar is overlaid. What can be done
local var_Bar as IBar
local var_Chart as IChart
local var_Items as IItems
local h as USUAL

oDCOCX_Exontrol1:ScrollBySingleLine := true
oDCOCX_Exontrol1:Columns:Add("Task")
oDCOCX_Exontrol1:DrawGridLines := exHLines
var_Chart := oDCOCX_Exontrol1:Chart
	var_Chart:DrawGridLines := exHLines
	var_Chart:AllowCreateBar := exCreateBarAuto
	var_Chart:AllowLinkBars := false
	var_Chart:ResizeUnitScale := exHour
	var_Chart:[PaneWidth,false] := 48
	var_Chart:FirstVisibleDate := SToD("20010101")
	var_Bar := var_Chart:Bars:[Item,"Task"]
		var_Bar:OverlaidType := exOverlaidBarsStackAutoArrange | exOverlaidBarsStack
		var_Bar:[Overlaid,exOverlaidBarsTransparent] := 0
var_Items := oDCOCX_Exontrol1:Items
	h := var_Items:AddItem("Task 1")
	var_Items:AddBar(h,"Task",SToD("20010102"),SToD("20010104"),"A1",nil)
	var_Items:[ItemBar,h,"A1",exBarTransparent] := 80
	var_Items:AddBar(h,"Task",SToD("20010103"),SToD("20010105"),"A2",nil)
	var_Items:AddBar(h,"Task",SToD("20010104"),SToD("20010107"),"A3",nil)
	h := var_Items:AddItem("Task 2")
	var_Items:AddBar(h,"Task",SToD("20010107"),SToD("20010110"),"A1",nil)
	var_Items:AddBar(h,"Task",SToD("20010108"),SToD("20010112"),"A3",nil)
	var_Items:[ItemBar,h,"A3",exBarTransparent] := 50
|
|
1294
|
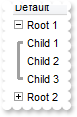
How can I show the child items with no identation
local var_Items as IItems
local h as USUAL

oDCOCX_Exontrol1:LinesAtRoot := exGroupLinesOutside
oDCOCX_Exontrol1:Indent := 12
oDCOCX_Exontrol1:HasLines := exThinLine
oDCOCX_Exontrol1:Columns:Add("Default")
var_Items := oDCOCX_Exontrol1:Items
	h := var_Items:AddItem("Root 1")
	var_Items:InsertItem(h,nil,"Child 1")
	var_Items:InsertItem(h,nil,"Child 2")
	var_Items:InsertItem(h,nil,"Child 3")
	var_Items:[ExpandItem,h] := true
	h := var_Items:AddItem("Root 2")
	var_Items:InsertItem(h,nil,"Child 1")
	var_Items:InsertItem(h,nil,"Child 2")
	var_Items:InsertItem(h,nil,"Child 3")
|
|
1293
|
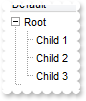
Is there other ways of showing the hierarchy lines (exGroupLinesAtRoot)
local var_Items as IItems
local h as USUAL

oDCOCX_Exontrol1:LinesAtRoot := exGroupLinesAtRoot
oDCOCX_Exontrol1:Indent := 12
oDCOCX_Exontrol1:Columns:Add("Default")
var_Items := oDCOCX_Exontrol1:Items
	h := var_Items:AddItem("Root")
	var_Items:InsertItem(h,nil,"Child 1")
	var_Items:InsertItem(h,nil,"Child 2")
	var_Items:InsertItem(h,nil,"Child 3")
	var_Items:[ExpandItem,h] := true
|
|
1292
|
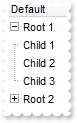
Is there other ways of showing the hierarchy lines (exGroupLinesOutside)
local var_Items as IItems
local h as USUAL

oDCOCX_Exontrol1:LinesAtRoot := exGroupLinesOutside
oDCOCX_Exontrol1:Indent := 12
oDCOCX_Exontrol1:Columns:Add("Default")
var_Items := oDCOCX_Exontrol1:Items
	h := var_Items:AddItem("Root 1")
	var_Items:InsertItem(h,nil,"Child 1")
	var_Items:InsertItem(h,nil,"Child 2")
	var_Items:InsertItem(h,nil,"Child 3")
	var_Items:[ExpandItem,h] := true
	h := var_Items:AddItem("Root 2")
	var_Items:InsertItem(h,nil,"Child 1")
	var_Items:InsertItem(h,nil,"Child 2")
	var_Items:InsertItem(h,nil,"Child 3")
|
|
1291
|
Is there other ways of showing the hierarchy lines (exGroupLinesInsideLeaf)

local var_Items as IItems
local h as USUAL

oDCOCX_Exontrol1:LinesAtRoot := exGroupLinesInsideLeaf
oDCOCX_Exontrol1:Indent := 12
oDCOCX_Exontrol1:Columns:Add("Default")
var_Items := oDCOCX_Exontrol1:Items
	h := var_Items:AddItem("Root")
	var_Items:InsertItem(h,nil,"Child 1")
	var_Items:InsertItem(h,nil,"Child 2")
	var_Items:InsertItem(h,nil,"Child 3")
	var_Items:[ExpandItem,h] := true
|
|
1290
|
Is there other ways of showing the hierarchy lines (exGroupLinesInside)

local var_Items as IItems
local h as USUAL

oDCOCX_Exontrol1:LinesAtRoot := exGroupLinesInside
oDCOCX_Exontrol1:Indent := 12
oDCOCX_Exontrol1:Columns:Add("Default")
var_Items := oDCOCX_Exontrol1:Items
	h := var_Items:AddItem("Root")
	var_Items:InsertItem(h,nil,"Child 1")
	var_Items:InsertItem(h,nil,"Child 2")
	var_Items:InsertItem(h,nil,"Child 3")
	var_Items:[ExpandItem,h] := true
|
|
1289
|
Is there other ways of showing the hierarchy lines (exGroupLines)

local var_Items as IItems
local h as USUAL

oDCOCX_Exontrol1:LinesAtRoot := exGroupLines
oDCOCX_Exontrol1:Indent := 12
oDCOCX_Exontrol1:Columns:Add("Default")
var_Items := oDCOCX_Exontrol1:Items
	h := var_Items:AddItem("Root")
	var_Items:InsertItem(h,nil,"Child 1")
	var_Items:InsertItem(var_Items:InsertItem(h,nil,"Child 2"),nil,"SubChild 2")
	var_Items:InsertItem(h,nil,"Child 3")
	var_Items:[ExpandItem,h] := true
|
|
1288
|
How can I specify non-working dates for any year, as a repetitive expression for instance
local var_Chart as IChart

var_Chart := oDCOCX_Exontrol1:Chart
	var_Chart:AdjustLevelsToBase := true
	var_Chart:[PaneWidth,false] := 0
	var_Chart:FirstVisibleDate := SToD("20101224")
	var_Chart:FirstWeekDay := exMonday
	var_Chart:LevelCount := 2
	var_Chart:NonworkingDays := 0
	var_Chart:AddNonworkingDate("shortdateF(value) left 5 in ('01/01','01/06','04/25','05/01','06/02','08/15','11/01','12/08','12/25','12/26')")
|
|
1287
|
Is it possible to specify the Easter and a day after as being non-working
local var_Chart as IChart

var_Chart := oDCOCX_Exontrol1:Chart
	var_Chart:AdjustLevelsToBase := true
	var_Chart:[PaneWidth,false] := 0
	var_Chart:FirstVisibleDate := SToD("20110414")
	var_Chart:FirstWeekDay := exMonday
	var_Chart:LevelCount := 2
	var_Chart:NonworkingDays := 0
	var_Chart:AddNonworkingDate("not(month(value) in (3,4,5)) ? 0 : ( floor(value)=(2:=floor(date(dateS('3/1/' + year(value)) + ((1:=(((255 - 11 * (year(value) mod 19)) - 21) mod 30) + 21) + (=:1 > 48 ? -1 : 0) + 6 - ((year(value) + int(year(value) / 4)) + =:1 + (=:1 > 48 ? -1 : 0) + 1) mod 7)))) or (floor(value)= =:2 + 1))")
|
|
1286
|
Here's a simple sample to compute the Easter day
local var_Editor as IEditor
local var_Items as IItems

oDCOCX_Exontrol1:BeginUpdate()
oDCOCX_Exontrol1:Chart:[PaneWidth,true] := 0
var_Editor := IColumn{oDCOCX_Exontrol1:Columns:Add("Year")}:Editor
	var_Editor:EditType := SpinType
	var_Editor:Numeric := exInteger
IColumn{oDCOCX_Exontrol1:Columns:Add("Easter")}:ComputedField := "date(dateS('3/1/' + int(%0)) + ((1:=(((255 - 11 * (int(%0) mod 19)) - 21) mod 30) + 21) + (=:1 > 48 ? -1 : 0) + 6 - ((int(%0) + int(int(%0) / 4)) + =:1 + (=:1 > 48 ? -1 : 0) + 1) mod 7))"
var_Items := oDCOCX_Exontrol1:Items
	var_Items:AddItem(2008)
	var_Items:AddItem(2009)
	var_Items:AddItem(2010)
	var_Items:AddItem(2011)
oDCOCX_Exontrol1:EndUpdate()
|
|
1285
|
How do I specify the Easter or holydays as non-working
local var_Chart as IChart

var_Chart := oDCOCX_Exontrol1:Chart
	var_Chart:AdjustLevelsToBase := true
	var_Chart:[PaneWidth,false] := 0
	var_Chart:FirstVisibleDate := SToD("20110414")
	var_Chart:FirstWeekDay := exMonday
	var_Chart:LevelCount := 2
	var_Chart:NonworkingDays := 0
	var_Chart:AddNonworkingDate("month(value) = 7")
	var_Chart:AddNonworkingDate("not(month(value) in (3,4)) ? 0 : ( floor(value)=floor(date(dateS('3/1/' + year(value)) + ((1:=(((255 - 11 * (year(value) mod 19)) - 21) mod 30) + 21) + (=:1 > 48 ? -1 : 0) + 6 - ((year(value) + int(year(value) / 4)) + =:1 + (=:1 > 48 ? -1 : 0) + 1) mod 7))))")
|
|
1284
|
Is it possible to add a repetitive expression to define non-working dates
local var_Chart as IChart

var_Chart := oDCOCX_Exontrol1:Chart
	var_Chart:[PaneWidth,false] := 0
	var_Chart:FirstVisibleDate := SToD("20100101")
	var_Chart:FirstWeekDay := exMonday
	var_Chart:LevelCount := 2
	var_Chart:AddNonworkingDate(SToD("20100113"))
	var_Chart:AddNonworkingDate("month(value) = 1 and (day(value) in (1,6))")
|
|
1283
|
How do I get the Easter date
local var_Items as IItems

IColumn{oDCOCX_Exontrol1:Columns:Add("Easter")}:FormatColumn := "date(dateS('3/1/' + year(value))  + ((1:=(((255 - 11 * (year(value) mod 19)) - 21) mod 30) + 21) + (=:1 > 48 ? -1 : 0) + 6 - ((year(value) + int(year(value) / 4)) + =:1 + (=:1 > 48 ? -1 : 0) + 1) mod 7))"
var_Items := oDCOCX_Exontrol1:Items
	var_Items:AddItem(SToD("19890101"))
	var_Items:AddItem(SToD("20010101"))
	var_Items:AddItem(SToD("20020101"))
	var_Items:AddItem(SToD("20030101"))
	var_Items:AddItem(SToD("20100101"))
|
|
1282
|
How can I calculate the number of visible units
METHOD OCX_Exontrol1Click() CLASS MainDialog
	// Click event - Occurs when the user presses and then releases the left mouse button over the tree control.
	local var_Chart as IChart
	var_Chart := oDCOCX_Exontrol1:Chart
		OutputDebugString(String2Psz( "UnitCount:" ))
		OutputDebugString(String2Psz( AsString(var_Chart:[CountVisibleUnits,var_Chart:[DateFromPoint,0,-1],var_Chart:[DateFromPoint,1,-1]]) ))
RETURN NIL

local var_Chart as IChart

var_Chart := oDCOCX_Exontrol1:Chart
	var_Chart:[PaneWidth,false] := 0
	var_Chart:FirstVisibleDate := SToD("20100101")
	var_Chart:LevelCount := 2
|
|
1281
|
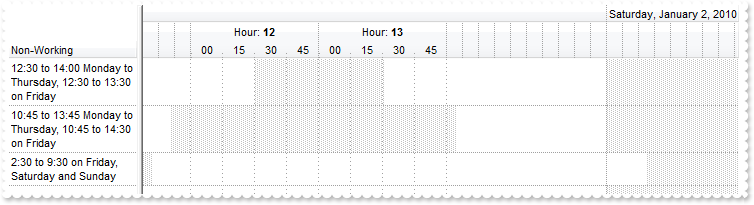
Is it possible to specify the nonworking up to minutes and I can see when using the inside zoom feature
local var_Chart as IChart
local var_InsideZoomFormat as IInsideZoomFormat
local var_Items as IItems
local var_Level as ILevel
local h as USUAL

oDCOCX_Exontrol1:BeginUpdate()
oDCOCX_Exontrol1:Chart:Bars:Add("Task:Split"):Shortcut := "Task"
oDCOCX_Exontrol1:DrawGridLines := exHLines
var_Chart := oDCOCX_Exontrol1:Chart
	var_Chart:DrawGridLines := exAllLines
	var_Chart:[PaneWidth,false] := 128
	var_Chart:LevelCount := 3
	var_Chart:UnitScale := exHour
	var_Chart:UnitWidth := 16
	var_Chart:DrawLevelSeparator := exLevelNoLine
	var_Level := var_Chart:[Level,2]
		var_Level:Unit := exMinute
		var_Level:Count := 60
	var_Chart:AllowCreateBar := exCreateBarAuto
	var_Chart:ResizeUnitScale := exMinute
	var_Chart:ResizeUnitCount := 15
	var_Chart:AllowInsideZoom := true
	var_InsideZoomFormat := var_Chart:DefaultInsideZoomFormat
		var_InsideZoomFormat:InsideUnit := exMinute
		var_InsideZoomFormat:InsideCount := 15
		var_InsideZoomFormat:InsideLabel := "<%nn%>"
		var_InsideZoomFormat:OwnerLabel := "Hour: <b><%h%>"
		var_InsideZoomFormat:DrawGridLines := true
	var_Chart:InsideZooms:Add(SToD("20100101 12:00:00"))
	var_Chart:InsideZooms:Add(SToD("20100101 13:00:00"))
	var_Chart:FirstVisibleDate := SToD("20100101 09:00:00")
IColumn{oDCOCX_Exontrol1:Columns:Add("Non-Working")}:[Def,exCellSingleLine] := false
var_Items := oDCOCX_Exontrol1:Items
	h := var_Items:AddItem("12:30 to 14:00 Monday to Thursday, 12:30 to 13:30 on Friday")
	var_Items:[ItemNonworkingUnits,h,false] := "weekday(value) case (default:((timeF(value)>=" + CHR(34) + "12:30:00" + CHR(34) + " and timeF(value) <=" + CHR(34) + "14:00:00" + CHR(34) + " ));5:( timeF(value)>=" + CHR(34) + "12:30:00" + CHR(34) + " and timeF(value) <=" + CHR(34) + "13:30:00" + CHR(34) + " );6:1;0:1) "
	h := var_Items:AddItem("10:45 to 13:45 Monday to Thursday, 10:45 to 14:30 on Friday")
	var_Items:[ItemNonworkingUnits,h,false] := "weekday(value) case (default:((timeF(value)>=" + CHR(34) + "10:45:00" + CHR(34) + " and timeF(value) <=" + CHR(34) + "13:45:00" + CHR(34) + " ));5:( timeF(value)>=" + CHR(34) + "10:45:00" + CHR(34) + " and timeF(value) <=" + CHR(34) + "14:30:00" + CHR(34) + " );6:1;0:1) "
	h := var_Items:AddItem("2:30 to 9:30 on Friday, Saturday and Sunday")
	var_Items:[ItemNonworkingUnits,h,false] := "weekday(value) case (default:((timeF(value)>=" + CHR(34) + "02:30:00" + CHR(34) + " and timeF(value) <=" + CHR(34) + "09:30:00" + CHR(34) + " ));1:0;2:0;3:0;4:0) "
oDCOCX_Exontrol1:EndUpdate()
|
|
1280
|
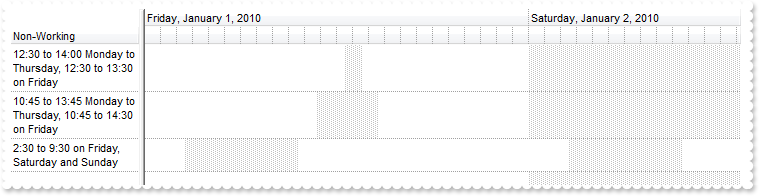
Is it possible to show the non-working units up to minutes
local var_Chart as IChart
local var_Items as IItems
local var_Level as ILevel
local h as USUAL

oDCOCX_Exontrol1:BeginUpdate()
oDCOCX_Exontrol1:Chart:Bars:Add("Task:Split"):Shortcut := "Task"
oDCOCX_Exontrol1:DrawGridLines := exHLines
var_Chart := oDCOCX_Exontrol1:Chart
	var_Chart:DrawGridLines := exHLines
	var_Chart:[PaneWidth,false] := 128
	var_Chart:FirstVisibleDate := SToD("20100101")
	var_Chart:LevelCount := 2
	var_Chart:UnitScale := exHour
	var_Chart:UnitWidth := 16
	var_Chart:DrawLevelSeparator := exLevelNoLine
	var_Level := var_Chart:[Level,1]
		var_Level:Unit := exMinute
		var_Level:Count := 60
	var_Chart:AllowCreateBar := exCreateBarAuto
	var_Chart:ResizeUnitScale := exMinute
	var_Chart:ResizeUnitCount := 15
IColumn{oDCOCX_Exontrol1:Columns:Add("Non-Working")}:[Def,exCellSingleLine] := false
var_Items := oDCOCX_Exontrol1:Items
	h := var_Items:AddItem("12:30 to 14:00 Monday to Thursday, 12:30 to 13:30 on Friday")
	var_Items:[ItemNonworkingUnits,h,false] := "weekday(value) case (default:((timeF(value)>=" + CHR(34) + "12:30:00" + CHR(34) + " and timeF(value) <=" + CHR(34) + "14:00:00" + CHR(34) + " ));5:( timeF(value)>=" + CHR(34) + "12:30:00" + CHR(34) + " and timeF(value) <=" + CHR(34) + "13:30:00" + CHR(34) + " );6:1;0:1) "
	h := var_Items:AddItem("10:45 to 13:45 Monday to Thursday, 10:45 to 14:30 on Friday")
	var_Items:[ItemNonworkingUnits,h,false] := "weekday(value) case (default:((timeF(value)>=" + CHR(34) + "10:45:00" + CHR(34) + " and timeF(value) <=" + CHR(34) + "13:45:00" + CHR(34) + " ));5:( timeF(value)>=" + CHR(34) + "10:45:00" + CHR(34) + " and timeF(value) <=" + CHR(34) + "14:30:00" + CHR(34) + " );6:1;0:1) "
	h := var_Items:AddItem("2:30 to 9:30 on Friday, Saturday and Sunday")
	var_Items:[ItemNonworkingUnits,h,false] := "weekday(value) case (default:((timeF(value)>=" + CHR(34) + "02:30:00" + CHR(34) + " and timeF(value) <=" + CHR(34) + "09:30:00" + CHR(34) + " ));1:0;2:0;3:0;4:0) "
oDCOCX_Exontrol1:EndUpdate()
|
|
1279
|
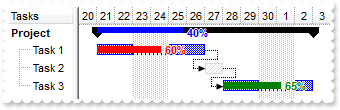
Is it possible to define several type of progress bars
local var_Bar,var_Bar1 as IBar
local var_Chart as IChart
local var_Items as IItems
local h,h1,h2,h3 as USUAL

oDCOCX_Exontrol1:BeginUpdate()
oDCOCX_Exontrol1:Columns:Add("Tasks")
IColumn{oDCOCX_Exontrol1:Columns:Add("Start")}:Visible := false
IColumn{oDCOCX_Exontrol1:Columns:Add("End")}:Visible := false
var_Chart := oDCOCX_Exontrol1:Chart
	var_Chart:FirstVisibleDate := SToD("20060920")
	var_Chart:[PaneWidth,false] := 64
	var_Bar := var_Chart:Bars:Copy("Progress","ProgressT")
		var_Bar:Color := RGB(255,0,0)
		var_Bar:Shape := exShapeSolid
		var_Bar:Height := 7
	var_Chart:Bars:Add("Task%ProgressT:Split"):Shortcut := "Task"
	var_Bar1 := var_Chart:Bars:[Item,"Progress"]
		var_Bar1:Color := RGB(0,0,255)
		var_Bar1:Shape := exShapeSolidUp
	var_Chart:Bars:Add("Summary%Progress"):Shortcut := "Summary"
var_Items := oDCOCX_Exontrol1:Items
	h := var_Items:AddItem("Project")
	var_Items:[ItemHeight,h] := 16
	var_Items:[CellValue,h,1] := SToD("20060921")
	var_Items:[CellValue,h,2] := SToD("20061003")
	var_Items:AddBar(h,"Summary",var_Items:[CellValue,h,1],var_Items:[CellValue,h,2],"sum",nil)
	var_Items:[ItemBar,h,"sum",exBarPercent] := 0.4
	var_Items:[ItemBar,h,"sum",exBarShowPercentCaption] := true
	h1 := var_Items:InsertItem(h,nil,"Task 1")
	var_Items:[CellValue,h1,1] := var_Items:[CellValue,h,1]
	var_Items:[CellValue,h1,2] := SToD("20060927")
	var_Items:AddBar(h1,"Task",var_Items:[CellValue,h1,1],var_Items:[CellValue,h1,2],"K1",nil)
	var_Items:[ItemBar,h1,"K1",exBarPercent] := 0.6
	var_Items:[ItemBar,h1,"K1",exBarShowPercentCaption] := true
	h2 := var_Items:InsertItem(h,nil,"Task 2")
	var_Items:[CellValue,h2,1] := var_Items:[CellValue,h1,2]
	var_Items:[CellValue,h2,2] := SToD("20060928")
	var_Items:AddBar(h2,"Unknown",var_Items:[CellValue,h2,1],var_Items:[CellValue,h2,2],"K2",nil)
	var_Items:AddLink("L1",h1,"K1",h2,"K2")
	h3 := var_Items:InsertItem(h,nil,"Task 3")
	var_Items:[CellValue,h3,1] := var_Items:[CellValue,h2,2]
	var_Items:[CellValue,h3,2] := var_Items:[CellValue,h,2]
	var_Items:AddBar(h3,"Task",var_Items:[CellValue,h3,1],var_Items:[CellValue,h3,2],"K3",nil)
	var_Items:[ItemBar,h3,"K3",exBarPercent] := 0.65
	var_Items:[ItemBar,h3,"K3",exBarShowPercentCaption] := true
	var_Items:[ItemBar,h3,"K3",exBarPercentColor] := 32768
	var_Items:AddLink("L2",h2,"K2",h3,"K3")
	var_Items:GroupBars(h1,"K1",false,h2,"K2",true,31,"0;4")
	var_Items:GroupBars(h2,"K2",false,h3,"K3",true,31,"0;2")
	var_Items:DefineSummaryBars(h,"sum",h1,"K1")
	var_Items:DefineSummaryBars(h,"sum",h2,"K2")
	var_Items:DefineSummaryBars(h,"sum",h3,"K3")
	var_Items:[ExpandItem,h] := true
	var_Items:[ItemBold,h] := true
oDCOCX_Exontrol1:EndUpdate()
|
|
1278
|
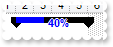
Is it possible to display the percent bar over the summary bar
local var_Bar as IBar
local var_Chart as IChart
local var_Items as IItems
local h as USUAL

oDCOCX_Exontrol1:BeginUpdate()
oDCOCX_Exontrol1:Columns:Add("Task")
var_Chart := oDCOCX_Exontrol1:Chart
	var_Chart:LevelCount := 2
	var_Chart:[PaneWidth,false] := 64
	var_Chart:FirstVisibleDate := SToD("20010101")
	var_Bar := var_Chart:Bars:[Item,"Progress"]
		var_Bar:Color := RGB(0,0,255)
		var_Bar:Shape := exShapeSolidUp
	var_Chart:Bars:Add("Summary%Progress"):Shortcut := "SummaryP"
var_Items := oDCOCX_Exontrol1:Items
	h := var_Items:AddItem("Summary")
	var_Items:AddBar(h,"SummaryP",SToD("20010102"),SToD("20010106"),"K1",nil)
	var_Items:[ItemBar,h,"K1",exBarPercent] := 0.4
	var_Items:[ItemBar,h,"K1",exBarShowPercentCaption] := true
oDCOCX_Exontrol1:EndUpdate()
|
|
1277
|
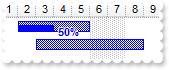
How can I display the percent value in the lower side of the bar
local var_Bar as IBar
local var_Chart as IChart
local var_Items as IItems
local h as USUAL

oDCOCX_Exontrol1:BeginUpdate()
oDCOCX_Exontrol1:Columns:Add("Task")
var_Chart := oDCOCX_Exontrol1:Chart
	var_Chart:[PaneWidth,false] := 48
	var_Chart:FirstVisibleDate := SToD("20010101")
	var_Bar := var_Chart:Bars:[Item,"Progress"]
		var_Bar:Shape := exShapeSolid
		var_Bar:Height := 7
		var_Bar:Color := RGB(0,0,255)
	var_Chart:Bars:Add("Task%Progress"):Shortcut := "Percent"
var_Items := oDCOCX_Exontrol1:Items
	h := var_Items:AddItem("Task 1")
	var_Items:AddBar(h,"Percent",SToD("20010102"),SToD("20010106"),"K1",nil)
	var_Items:[ItemBar,h,"K1",exBarPercent] := 0.5
	var_Items:[ItemBar,h,"K1",exBarShowPercentCaption] := true
	var_Items:[ItemBar,h,"K1",exBarVAlignPercent] := 2
	h := var_Items:AddItem("Task 2")
	var_Items:AddBar(h,"Percent",SToD("20010103"),SToD("20010109"),"K2",nil)
oDCOCX_Exontrol1:EndUpdate()
|
|
1276
|
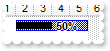
Is it possible to change the percent's height
local var_Bar as IBar
local var_Chart as IChart
local var_Items as IItems
local h as USUAL

oDCOCX_Exontrol1:BeginUpdate()
oDCOCX_Exontrol1:Columns:Add("Task")
var_Chart := oDCOCX_Exontrol1:Chart
	var_Chart:[PaneWidth,false] := 48
	var_Chart:FirstVisibleDate := SToD("20010101")
	var_Bar := var_Chart:Bars:[Item,"Progress"]
		var_Bar:Shape := exShapeSolid
		var_Bar:Height := 7
	var_Chart:Bars:Add("Task%Progress")
var_Items := oDCOCX_Exontrol1:Items
	h := var_Items:AddItem("Task 1")
	var_Items:AddBar(h,"Task%Progress",SToD("20010102"),SToD("20010106"),"K1",nil)
	var_Items:[ItemBar,h,"K1",exBarPercent] := 0.5
	var_Items:[ItemBar,h,"K1",exBarShowPercentCaption] := true
oDCOCX_Exontrol1:EndUpdate()
|
|
1275
|
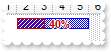
How can I change the pattern for the percent bar
local var_Bar as IBar
local var_Chart as IChart
local var_Items as IItems
local h as USUAL

oDCOCX_Exontrol1:BeginUpdate()
oDCOCX_Exontrol1:Columns:Add("Task")
var_Chart := oDCOCX_Exontrol1:Chart
	var_Chart:[PaneWidth,false] := 48
	var_Chart:FirstVisibleDate := SToD("20010101")
	var_Bar := var_Chart:Bars:[Item,"Progress"]
		var_Bar:Pattern := exPatternBDiagonal
		var_Bar:Shape := exShapeSolid
		var_Bar:Color := RGB(196,0,0)
	var_Chart:Bars:Add("Task%Progress")
var_Items := oDCOCX_Exontrol1:Items
	h := var_Items:AddItem("Task 1")
	var_Items:AddBar(h,"Task%Progress",SToD("20010102"),SToD("20010106"),"K1",nil)
	var_Items:[ItemBar,h,"K1",exBarPercent] := 0.4
	var_Items:[ItemBar,h,"K1",exBarShowPercentCaption] := true
oDCOCX_Exontrol1:EndUpdate()
|
|
1274
|
How can I change the look for the percent bar using EBN
local var_Bar as IBar
local var_Chart as IChart
local var_Items as IItems
local h as USUAL

oDCOCX_Exontrol1:BeginUpdate()
oDCOCX_Exontrol1:VisualAppearance:Add(1,"c:\exontrol\images\hot.ebn")
oDCOCX_Exontrol1:Columns:Add("Task")
var_Chart := oDCOCX_Exontrol1:Chart
	var_Chart:FirstVisibleDate := SToD("20010101")
	var_Bar := var_Chart:Bars:[Item,"Progress"]
		var_Bar:Color := 0x1000000
		var_Bar:Shape := exShapeSolid
		var_Bar:Height := 7
	var_Chart:Bars:Add("Task%Progress")
var_Items := oDCOCX_Exontrol1:Items
	h := var_Items:AddItem("Task 1")
	var_Items:AddBar(h,"Task%Progress",SToD("20010102"),SToD("20010106"),"K1",nil)
	var_Items:[ItemBar,h,"K1",exBarPercent] := 0.4
oDCOCX_Exontrol1:EndUpdate()
|
|
1273
|
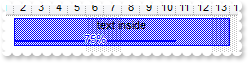
Is it possible to align the percent bar to the bottom of the bar
local var_Chart as IChart
local var_Items as IItems
local h as USUAL

oDCOCX_Exontrol1:BeginUpdate()
oDCOCX_Exontrol1:DefaultItemHeight := 32
oDCOCX_Exontrol1:Columns:Add("Task")
var_Chart := oDCOCX_Exontrol1:Chart
	var_Chart:[PaneWidth,false] := 64
	var_Chart:FirstVisibleDate := SToD("20010101")
	var_Chart:Bars:[Item,"Task"]:Height := 28
	var_Chart:Bars:Add("Task%Progress"):Shortcut := "Percent"
var_Items := oDCOCX_Exontrol1:Items
	h := var_Items:AddItem("Task 1")
	var_Items:AddBar(h,"Percent",SToD("20010102"),SToD("20010114"),"K1","text inside")
	var_Items:[ItemBar,h,"K1",exBarVAlignCaption] := 0
	var_Items:[ItemBar,h,"K1",exBarPercent] := 0.75
	var_Items:[ItemBar,h,"K1",exBarShowPercentCaption] := true
	var_Items:[ItemBar,h,"K1",exBarPercentCaptionFormat] := "%p%"
	var_Items:[ItemBar,h,"K1",exBarVAlignPercent] := 2
oDCOCX_Exontrol1:EndUpdate()
|
|
1272
|
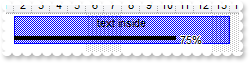
Is it possible to show the percent on the bottom side of the bar, so I can leave the text upside
local var_Bar as IBar
local var_Bars as IBars
local var_Chart as IChart
local var_Items as IItems
local h as USUAL

oDCOCX_Exontrol1:BeginUpdate()
oDCOCX_Exontrol1:DefaultItemHeight := 32
oDCOCX_Exontrol1:Columns:Add("Task")
var_Chart := oDCOCX_Exontrol1:Chart
	var_Chart:[PaneWidth,false] := 64
	var_Chart:FirstVisibleDate := SToD("20010101")
	var_Bars := var_Chart:Bars
		var_Bars:[Item,"Task"]:Height := 28
		var_Bar := var_Bars:[Item,"Progress"]
			var_Bar:Shape := exShapeThinDown
			var_Bar:Height := 20
			var_Bar:Color := RGB(0,0,255)
		var_Bars:Add("Task%Progress"):Shortcut := "Percent"
var_Items := oDCOCX_Exontrol1:Items
	h := var_Items:AddItem("Task 1")
	var_Items:AddBar(h,"Percent",SToD("20010102"),SToD("20010114"),"K1","text inside")
	var_Items:[ItemBar,h,"K1",exBarVAlignCaption] := 0
	var_Items:[ItemBar,h,"K1",exBarPercent] := 0.75
	var_Items:[ItemBar,h,"K1",exBarShowPercentCaption] := true
	var_Items:[ItemBar,h,"K1",exBarPercentCaptionFormat] := "<br>%p%"
	var_Items:[ItemBar,h,"K1",exBarAlignPercentCaption] := 1
	var_Items:[ItemBar,h,"K1",exBarCanResizePercent] := false
oDCOCX_Exontrol1:EndUpdate()
|
|
1271
|
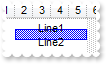
Is it possible to assign a multiple lines labels/captions to a bar
local var_Items as IItems
local h as USUAL

oDCOCX_Exontrol1:Columns:Add("Task")
oDCOCX_Exontrol1:Chart:FirstVisibleDate := SToD("20010101")
var_Items := oDCOCX_Exontrol1:Items
	h := var_Items:AddItem("Task 1")
	var_Items:[ItemHeight,h] := 32
	var_Items:AddBar(h,"Task",SToD("20010102"),SToD("20010106"),"K1",nil)
	var_Items:[ItemBar,h,"K1",exBarCaption] := "Line1<br>Line2"
|
|
1270
|
Does your control supports multiple lines tooltip
oDCOCX_Exontrol1:[HTMLPicture,"pic1"] := "c:\exontrol\images\zipdisk.gif"
oDCOCX_Exontrol1:ToolTipDelay := 1
IColumn{oDCOCX_Exontrol1:Columns:Add("tootip")}:ToolTip := "<font Tahoma;20>This</font> is a <b>multi-lines</b> tooltip assigned to a column. The tooltip supports built-in HTML tags, icons and pictures.<br><img>pic1</img> picture ..."
|
|
1269
|
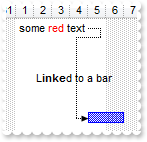
It is possible to write the word in red/color or to add a tooltip or a link to the word
local var_Chart as IChart
local var_Items as IItems
local h1,h2 as USUAL

oDCOCX_Exontrol1:Columns:Add("Task")
var_Chart := oDCOCX_Exontrol1:Chart
	var_Chart:LevelCount := 2
	var_Chart:FirstVisibleDate := SToD("20001226")
	var_Chart:[PaneWidth,false] := 32
var_Items := oDCOCX_Exontrol1:Items
	h1 := var_Items:AddItem("Task 1")
	var_Items:AddBar(h1,"",SToD("20010101"),SToD("20010105"),"K1","some <fgcolor=FF0000>red</fgcolor> text")
	var_Items:[ItemBar,h1,"K1",exBarCanResize] := false
	var_Items:[ItemBar,h1,"K1",exBarToolTip] := "And here goes the <b>tooltip</b> of the text. "
	var_Items:AddItem("")
	var_Items:AddItem("")
	var_Items:AddItem("")
	var_Items:AddItem("")
	h2 := var_Items:AddItem("Task 2")
	var_Items:AddBar(h2,"Task",SToD("20010105"),SToD("20010107"),"K2",nil)
	var_Items:[ItemBar,h2,"K2",exBarToolTip] := "And here goes the <b>tooltip</b> of the bar. "
	var_Items:AddLink("L1",h1,"K1",h2,"K2")
	var_Items:[Link,"L1",exLinkText] := "L<b>inke</b>d to a bar"
	var_Items:[Link,"L1",exLinkToolTip] := "And here goes the <b>tooltip</b> of the link. "
|
|
1268
|
It is possible to use seconds/minutes/hours as time scale in your control, but using my regional settings
local var_Chart,var_Chart1 as IChart
local var_Level as ILevel
oDCOCX_Exontrol1:BeginUpdate()
var_Chart := oDCOCX_Exontrol1:Chart
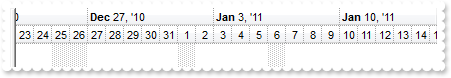
var_Chart:[Label,exMonth] := "<|><%loc_m1%><|><%loc_m2%><|><%loc_m3%><|><%loc_mmmm%><|><%loc_m3%> '<%yy%><|><%loc_mmmm%> <%yyyy%>"
var_Chart:[Label,exWeek] := "<|><%ww%><|><%loc_m3%> <%d%>, '<%yy%><r><%ww%><|><%loc_mmmm%> <%d%>, <%yyyy%><r><%ww%><||><||>256"
var_Chart:[Label,exDay] := "<|><%loc_d1%><|><%loc_d2%><|><%loc_d3%><|><%loc_dddd%><|><%loc_d3%>, <%loc_m3%> <%d%>, '<%yy%><|><%loc_dddd%>, <%loc_mmmm%> <%d%>, <%yyyy%><||><||>4096"
var_Chart:[Label,exHour] := "<|><%hh%><|><%h%> <%AM/PM%><|><%loc_d3%>, <%loc_m3%> <%d%>, '<%yy%> <%h%> <%AM/PM%><|><%loc_dddd%>, <%loc_mmmm%> <%d%>, <%yyyy%> <%h%> <%AM/PM%><||><||>65536"
var_Chart:[Label,exMinute] := "<|><%nn%><|><%h%>:<%nn%> <%AM/PM%><|><%loc_d3%>, <%loc_m3%> <%d%>, '<%yy%> <%h%>:<%nn%> <%AM/PM%><|><%loc_dddd%>, <%loc_mmmm%> <%d%>, <%yyyy%> <%h%>:<%nn%> <%AM/PM%>"
var_Chart:[Label,exSecond] := "<|><%ss%><|><%nn%>:<%ss%><|><%h%>:<%nn%>:<%ss%> <%AM/PM%><|><%loc_d3%>, <%loc_m3%> <%d%>, '<%yy%> <%h%>:<%nn%>:<%ss%> <%AM/PM%><|><%loc_dddd%>, <%loc_mmmm%> <%d%>, <%yyyy%> <%h%>:<%nn%>:<%ss%> <%AM/PM%>"
var_Chart:[LabelToolTip,exMonth] := "<%loc_mmmm%>/<%yyyy%>"
var_Chart:[LabelToolTip,exWeek] := "<%loc_mmmm%> <%d%>, <%yyyy%> <%ww%>"
var_Chart:[LabelToolTip,exDay] := "<%loc_dddd%>, <%loc_mmmm%> <%d%>, <%yyyy%>"
var_Chart:[LabelToolTip,exHour] := "<%loc_dddd%>, <%loc_mmmm%> <%d%>, <%yyyy%> <%h%> <%AM/PM%>"
var_Chart:[LabelToolTip,exMinute] := "<%loc_dddd%>, <%loc_mmmm%> <%d%>, <%yyyy%> <%h%>:<%nn%> <%AM/PM%>"
var_Chart:[LabelToolTip,exSecond] := "<%loc_dddd%>, <%loc_mmmm%> <%d%>, <%yyyy%> <%h%>:<%nn%>:<%ss%> <%AM/PM%>"
var_Chart1 := oDCOCX_Exontrol1:Chart
var_Chart1:[PaneWidth,false] := 0
var_Chart1:FirstVisibleDate := SToD("20010101")
var_Chart1:LevelCount := 4
var_Chart1:[Level,0]:Label := 4096
var_Chart1:[Level,1]:Label := 65536
var_Chart1:[Level,2]:Label := 1048576
var_Level := var_Chart1:[Level,3]
var_Level:Count := 15
var_Level:Label := 16777216
oDCOCX_Exontrol1:EndUpdate()
|
|
1267
|
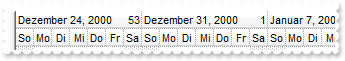
The chart's header is displayed in English. Can I change so it is the same as in my regional settings
local var_Chart,var_Chart1 as IChart

oDCOCX_Exontrol1:BeginUpdate()
var_Chart := oDCOCX_Exontrol1:Chart
	var_Chart:[Label,exMonth] := "<|><%loc_m1%><|><%loc_m2%><|><%loc_m3%><|><%loc_mmmm%><|><%loc_m3%> '<%yy%><|><%loc_mmmm%> <%yyyy%>"
	var_Chart:[Label,exWeek] := "<|><%ww%><|><%loc_m3%> <%d%>, '<%yy%><r><%ww%><|><%loc_mmmm%> <%d%>, <%yyyy%><r><%ww%><||><||>256"
	var_Chart:[Label,exDay] := "<|><%loc_d1%><|><%loc_d2%><|><%loc_d3%><|><%loc_dddd%><|><%loc_d3%>, <%loc_m3%> <%d%>, '<%yy%><|><%loc_dddd%>, <%loc_mmmm%> <%d%>, <%yyyy%><||><||>4096"
	var_Chart:[Label,exHour] := "<|><%hh%><|><%h%> <%AM/PM%><|><%loc_d3%>, <%loc_m3%> <%d%>, '<%yy%> <%h%> <%AM/PM%><|><%loc_dddd%>, <%loc_mmmm%> <%d%>, <%yyyy%> <%h%> <%AM/PM%><||><||>65536"
	var_Chart:[Label,exMinute] := "<|><%nn%><|><%h%>:<%nn%> <%AM/PM%><|><%loc_d3%>, <%loc_m3%> <%d%>, '<%yy%> <%h%>:<%nn%> <%AM/PM%><|><%loc_dddd%>, <%loc_mmmm%> <%d%>, <%yyyy%> <%h%>:<%nn%> <%AM/PM%>"
	var_Chart:[Label,exSecond] := "<|><%ss%><|><%nn%>:<%ss%><|><%h%>:<%nn%>:<%ss%> <%AM/PM%><|><%loc_d3%>, <%loc_m3%> <%d%>, '<%yy%> <%h%>:<%nn%>:<%ss%> <%AM/PM%><|><%loc_dddd%>, <%loc_mmmm%> <%d%>, <%yyyy%> <%h%>:<%nn%>:<%ss%> <%AM/PM%>"
	var_Chart:[LabelToolTip,exMonth] := "<%loc_mmmm%>/<%yyyy%>"
	var_Chart:[LabelToolTip,exWeek] := "<%loc_mmmm%> <%d%>, <%yyyy%> <%ww%>"
	var_Chart:[LabelToolTip,exDay] := "<%loc_dddd%>, <%loc_mmmm%> <%d%>, <%yyyy%>"
	var_Chart:[LabelToolTip,exHour] := "<%loc_dddd%>, <%loc_mmmm%> <%d%>, <%yyyy%> <%h%> <%AM/PM%>"
	var_Chart:[LabelToolTip,exMinute] := "<%loc_dddd%>, <%loc_mmmm%> <%d%>, <%yyyy%> <%h%>:<%nn%> <%AM/PM%>"
	var_Chart:[LabelToolTip,exSecond] := "<%loc_dddd%>, <%loc_mmmm%> <%d%>, <%yyyy%> <%h%>:<%nn%>:<%ss%> <%AM/PM%>"
var_Chart1 := oDCOCX_Exontrol1:Chart
	var_Chart1:[PaneWidth,false] := 0
	var_Chart1:FirstVisibleDate := SToD("20010101")
	var_Chart1:LevelCount := 2
	var_Chart1:UnitScale := exDay
oDCOCX_Exontrol1:EndUpdate()
|
|
1266
|
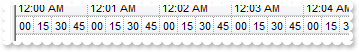
It is possible to use seconds/minutes/hours as time scale in your control
local var_Chart as IChart
local var_Level as ILevel

oDCOCX_Exontrol1:BeginUpdate()
var_Chart := oDCOCX_Exontrol1:Chart
	var_Chart:[PaneWidth,false] := 0
	var_Chart:FirstVisibleDate := SToD("20010101")
	var_Chart:LevelCount := 4
	var_Chart:[Level,0]:Label := 4096
	var_Chart:[Level,1]:Label := 65536
	var_Chart:[Level,2]:Label := 1048576
	var_Level := var_Chart:[Level,3]
		var_Level:Count := 15
		var_Level:Label := 16777216
oDCOCX_Exontrol1:EndUpdate()
|
|
1265
|
Is it possible to resize chart's column/level using the mouse as we can for the columns, but do not want to resize up to hours
local var_Chart as IChart
local var_InsideZoomFormat as IInsideZoomFormat
local var_InsideZooms as IInsideZooms
local var_Items as IItems

oDCOCX_Exontrol1:BeginUpdate()
var_Chart := oDCOCX_Exontrol1:Chart
	var_Chart:[PaneWidth,false] := 32
	var_Chart:LevelCount := 2
	var_Chart:FirstVisibleDate := SToD("20080101")
	var_Chart:AllowInsideZoom := true
	var_Chart:AllowResizeInsideZoom := true
	var_Chart:InsideZoomOnDblClick := false
	var_InsideZoomFormat := var_Chart:DefaultInsideZoomFormat
		var_InsideZoomFormat:OwnerLabel := "<%d%>"
		var_InsideZoomFormat:InsideLabel := ""
		var_InsideZoomFormat:InsideUnit := exHour
		var_InsideZoomFormat:InsideCount := 24
		var_InsideZoomFormat:DrawTickLines := false
		var_InsideZoomFormat:DrawGridLines := false
	var_InsideZooms := var_Chart:InsideZooms
		var_InsideZooms:SplitBaseLevel := false
		var_InsideZooms:DefaultWidth := 18
oDCOCX_Exontrol1:Columns:Add("Default")
var_Items := oDCOCX_Exontrol1:Items
	var_Items:AddBar(var_Items:AddItem("Task"),"Task",SToD("20080103"),SToD("20080108"),nil,nil)
oDCOCX_Exontrol1:EndUpdate()
|
|
1264
|
Is it possible to resize chart's column/level using the mouse as we can for the columns
local var_Chart as IChart
local var_InsideZoomFormat as IInsideZoomFormat
local var_InsideZooms as IInsideZooms
local var_Items as IItems

oDCOCX_Exontrol1:BeginUpdate()
var_Chart := oDCOCX_Exontrol1:Chart
	var_Chart:[PaneWidth,false] := 32
	var_Chart:LevelCount := 2
	var_Chart:FirstVisibleDate := SToD("20080101")
	var_Chart:AllowInsideZoom := true
	var_Chart:AllowResizeInsideZoom := true
	var_Chart:InsideZoomOnDblClick := false
	var_InsideZoomFormat := var_Chart:DefaultInsideZoomFormat
		var_InsideZoomFormat:OwnerLabel := "<%d%>"
		var_InsideZoomFormat:InsideLabel := ""
		var_InsideZoomFormat:DrawTickLines := false
		var_InsideZoomFormat:DrawGridLines := false
	var_InsideZooms := var_Chart:InsideZooms
		var_InsideZooms:SplitBaseLevel := false
		var_InsideZooms:DefaultWidth := 18
oDCOCX_Exontrol1:Columns:Add("Default")
var_Items := oDCOCX_Exontrol1:Items
	var_Items:AddBar(var_Items:AddItem("Task"),"Task",SToD("20080103"),SToD("20080108"),nil,nil)
oDCOCX_Exontrol1:EndUpdate()
|
|
1263
|
How can I empty or clear the undo/redo queue
local var_Chart as IChart
local var_Items as IItems

oDCOCX_Exontrol1:BeginUpdate()
oDCOCX_Exontrol1:Columns:Add("Tasks")
var_Chart := oDCOCX_Exontrol1:Chart
	var_Chart:AllowUndoRedo := true
	var_Chart:FirstVisibleDate := SToD("20050620")
	var_Chart:AllowLinkBars := true
	var_Chart:LevelCount := 2
	var_Chart:[PaneWidth,false] := 48
var_Items := oDCOCX_Exontrol1:Items
	var_Items:AddBar(var_Items:AddItem("Task 1"),"Task",SToD("20050621"),SToD("20050625"),"",nil)
	var_Items:AddBar(var_Items:AddItem("Task 2"),"Task",SToD("20050628"),SToD("20050702"),"",nil)
	OutputDebugString(String2Psz( oDCOCX_Exontrol1:Chart:[UndoListAction,nil,nil] ))
	OutputDebugString(String2Psz( "Clear undo/redo queue" ))
	oDCOCX_Exontrol1:Chart:AllowUndoRedo := false
	oDCOCX_Exontrol1:Chart:AllowUndoRedo := true
	OutputDebugString(String2Psz( oDCOCX_Exontrol1:Chart:[UndoListAction,nil,nil] ))
oDCOCX_Exontrol1:EndUpdate()
|
|
1262
|
How can I remove the undo/redo queue
local var_Chart as IChart
local var_Items as IItems

oDCOCX_Exontrol1:BeginUpdate()
oDCOCX_Exontrol1:Columns:Add("Tasks")
var_Chart := oDCOCX_Exontrol1:Chart
	var_Chart:AllowUndoRedo := true
	var_Chart:FirstVisibleDate := SToD("20050620")
	var_Chart:AllowLinkBars := true
	var_Chart:LevelCount := 2
	var_Chart:[PaneWidth,false] := 48
var_Items := oDCOCX_Exontrol1:Items
	var_Items:AddBar(var_Items:AddItem("Task 1"),"Task",SToD("20050621"),SToD("20050625"),"",nil)
	var_Items:AddBar(var_Items:AddItem("Task 2"),"Task",SToD("20050628"),SToD("20050702"),"",nil)
	OutputDebugString(String2Psz( oDCOCX_Exontrol1:Chart:[UndoListAction,nil,nil] ))
	OutputDebugString(String2Psz( "Clear undo/redo queue" ))
	oDCOCX_Exontrol1:Chart:UndoRemoveAction(nil,nil)
	oDCOCX_Exontrol1:Chart:RedoRemoveAction(nil,nil)
	OutputDebugString(String2Psz( oDCOCX_Exontrol1:Chart:[UndoListAction,nil,nil] ))
oDCOCX_Exontrol1:EndUpdate()
|
|
1261
|
Is it possible to prevent adding an undo operation for instance the RemoveLink(LinkKey) I call during the AddLink event
METHOD OCX_Exontrol1AddLink(LinkKey) CLASS MainDialog
	// AddLink event - Occurs when the user links two bars using the mouse.
	oDCOCX_Exontrol1:Items:RemoveLink(LinkKey)
	oDCOCX_Exontrol1:Chart:UndoRemoveAction(10,1)
	oDCOCX_Exontrol1:Chart:UndoRemoveAction(11,1)
	OutputDebugString(String2Psz( oDCOCX_Exontrol1:Chart:[UndoListAction,nil,nil] ))
RETURN NIL

METHOD OCX_Exontrol1ChartEndChanging(Operation) CLASS MainDialog
	// ChartEndChanging event - Occurs after the chart has been changed.
	OutputDebugString(String2Psz( oDCOCX_Exontrol1:Chart:[UndoListAction,nil,nil] ))
RETURN NIL

local var_Chart as IChart
local var_Items as IItems

oDCOCX_Exontrol1:BeginUpdate()
oDCOCX_Exontrol1:Columns:Add("Tasks")
var_Chart := oDCOCX_Exontrol1:Chart
	var_Chart:AllowUndoRedo := true
	var_Chart:FirstVisibleDate := SToD("20050620")
	var_Chart:AllowLinkBars := true
	var_Chart:LevelCount := 2
	var_Chart:[PaneWidth,false] := 48
var_Items := oDCOCX_Exontrol1:Items
	var_Items:AddBar(var_Items:AddItem("Task 1"),"Task",SToD("20050621"),SToD("20050625"),"",nil)
	var_Items:AddBar(var_Items:AddItem("Task 2"),"Task",SToD("20050628"),SToD("20050702"),"",nil)
oDCOCX_Exontrol1:EndUpdate()
|
|
1260
|
Is it possible to rename the links from "Link1" to my choice
METHOD OCX_Exontrol1AddLink(LinkKey) CLASS MainDialog
	// AddLink event - Occurs when the user links two bars using the mouse.
	oDCOCX_Exontrol1:Items:[Link,LinkKey,exLinkKey] := "newIDlink"
RETURN NIL

METHOD OCX_Exontrol1MouseMove(Button, Shift, X, Y) CLASS MainDialog
	// MouseMove event - Occurs when the user moves the mouse.
	OutputDebugString(String2Psz( AsString(oDCOCX_Exontrol1:Chart:[LinkFromPoint,-1,-1]) ))
RETURN NIL

local var_Chart as IChart
local var_Items as IItems

oDCOCX_Exontrol1:BeginUpdate()
oDCOCX_Exontrol1:Columns:Add("Tasks")
var_Chart := oDCOCX_Exontrol1:Chart
	var_Chart:FirstVisibleDate := SToD("20050620")
	var_Chart:AllowLinkBars := true
	var_Chart:LevelCount := 2
	var_Chart:[PaneWidth,false] := 48
var_Items := oDCOCX_Exontrol1:Items
	var_Items:AddBar(var_Items:AddItem("Task 1"),"Task",SToD("20050621"),SToD("20050625"),"",nil)
	var_Items:AddBar(var_Items:AddItem("Task 2"),"Task",SToD("20050628"),SToD("20050702"),"",nil)
oDCOCX_Exontrol1:EndUpdate()
|
|
1259
|
How can I prevent highlighting the column from the cursor - point
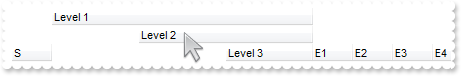
oDCOCX_Exontrol1:VisualAppearance:Add(1,"gBFLBCJwBAEHhEJAEGg4BI0IQAAYAQGKIYBkAKBQAGaAoDDUOQzQwAAxDKKUEwsACEIrjKCYVgOHYYRrIMYgBCMJhLEoaZLhEZRQiqDYtRDFQBSDDcPw/EaRZohGaYJgEgI=")
oDCOCX_Exontrol1:[Background,exCursorHoverColumn] := 0x1000000
IColumn{oDCOCX_Exontrol1:Columns:Add("S")}:Width := 32
IColumn{oDCOCX_Exontrol1:Columns:Add("Level 1")}:LevelKey := 1
IColumn{oDCOCX_Exontrol1:Columns:Add("Level 2")}:LevelKey := 1
IColumn{oDCOCX_Exontrol1:Columns:Add("Level 3")}:LevelKey := 1
IColumn{oDCOCX_Exontrol1:Columns:Add("E1")}:Width := 32
IColumn{oDCOCX_Exontrol1:Columns:Add("E2")}:Width := 32
IColumn{oDCOCX_Exontrol1:Columns:Add("E3")}:Width := 32
IColumn{oDCOCX_Exontrol1:Columns:Add("E4")}:Width := 32
|
|
1258
|
Is it possible to specify the background color for the item in the chart part only
local var_Items as IItems
local h,hC as USUAL

oDCOCX_Exontrol1:Columns:Add("Default")
var_Items := oDCOCX_Exontrol1:Items
	h := var_Items:AddItem("Root")
	hC := var_Items:InsertItem(h,nil,"Child 1")
	oDCOCX_Exontrol1:Chart:[ItemBackColor,hC] := RGB(255,0,0)
	var_Items:InsertItem(h,nil,"Child 2")
	var_Items:[ExpandItem,h] := true
|
|
1257
|
Is it possible to apply different visual appearance, color, sizes for item in the list and chart part
local var_Items as IItems
local h,hC as USUAL

oDCOCX_Exontrol1:VisualAppearance:Add(1,"c:\exontrol\images\normal.ebn")
oDCOCX_Exontrol1:VisualAppearance:Add(2,"c:\exontrol\images\pushed.ebn")
oDCOCX_Exontrol1:VisualAppearance:Add(3,"CP:2 2 2 -2 -2")
oDCOCX_Exontrol1:Columns:Add("Default")
oDCOCX_Exontrol1:SelBackMode := exTransparent
var_Items := oDCOCX_Exontrol1:Items
	h := var_Items:AddItem("Root")
	hC := var_Items:InsertItem(h,nil,"Child 1")
	var_Items:[ItemBackColor,hC] := 0x1ffff00
	oDCOCX_Exontrol1:Chart:[ItemBackColor,hC] := 0x300ff00
	var_Items:InsertItem(h,nil,"Child 2")
	var_Items:[ExpandItem,h] := true
|
|
1256
|
How do I change the visual appearance for the entire item, using your EBN technology
local var_Items as IItems
local h,hC as USUAL

oDCOCX_Exontrol1:VisualAppearance:Add(1,"c:\exontrol\images\normal.ebn")
oDCOCX_Exontrol1:Columns:Add("Default")
var_Items := oDCOCX_Exontrol1:Items
	h := var_Items:AddItem("Root")
	hC := var_Items:InsertItem(h,nil,"Child 1")
	var_Items:[ItemBackColor,hC] := 0x1000000
	oDCOCX_Exontrol1:Chart:[ItemBackColor,hC] := 0x1000000
	var_Items:InsertItem(h,nil,"Child 2")
	var_Items:[ExpandItem,h] := true
|
|
1255
|
is it possible to specify the a different background color for the item, list and chart part
local var_Items as IItems
local h,hC as USUAL

oDCOCX_Exontrol1:Columns:Add("Default")
var_Items := oDCOCX_Exontrol1:Items
	h := var_Items:AddItem("Root")
	hC := var_Items:InsertItem(h,nil,"Child 1")
	var_Items:[ItemBackColor,hC] := RGB(255,0,0)
	oDCOCX_Exontrol1:Chart:[ItemBackColor,hC] := RGB(255,255,0)
	var_Items:InsertItem(h,nil,"Child 2")
	var_Items:[ExpandItem,h] := true
|
|
1254
|
Is it possible to specify the background color for the entire row, including the chart part
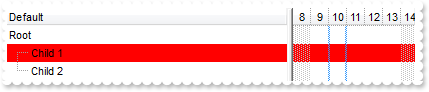
local var_Items as IItems
local h,hC as USUAL

oDCOCX_Exontrol1:Columns:Add("Default")
var_Items := oDCOCX_Exontrol1:Items
	h := var_Items:AddItem("Root")
	hC := var_Items:InsertItem(h,nil,"Child 1")
	var_Items:[ItemBackColor,hC] := RGB(255,0,0)
	oDCOCX_Exontrol1:Chart:[ItemBackColor,hC] := RGB(255,0,0)
	var_Items:InsertItem(h,nil,"Child 2")
	var_Items:[ExpandItem,h] := true
|
|
1253
|
Is it possible to prevent overlaying the bars while moving or resizing the bars, so they get arranged once the bar is moved or resized
local var_Chart as IChart
local var_Items as IItems
local h as USUAL

oDCOCX_Exontrol1:BeginUpdate()
oDCOCX_Exontrol1:ScrollBySingleLine := true
oDCOCX_Exontrol1:Columns:Add("Task")
oDCOCX_Exontrol1:DrawGridLines := exHLines
var_Chart := oDCOCX_Exontrol1:Chart
	var_Chart:OverlaidOnMoving := false
	var_Chart:DrawGridLines := exHLines
	var_Chart:AllowCreateBar := exCreateBarAuto
	var_Chart:AllowLinkBars := false
	var_Chart:ResizeUnitScale := exHour
	var_Chart:[PaneWidth,false] := 48
	var_Chart:FirstVisibleDate := SToD("20010101")
	var_Chart:Bars:[Item,"Task"]:OverlaidType := exOverlaidBarsStackAutoArrange | exOverlaidBarsStack
var_Items := oDCOCX_Exontrol1:Items
	var_Items:AddItem("")
	h := var_Items:AddItem("Task")
	var_Items:AddBar(h,"Task",SToD("20010107"),SToD("20010110"),"A1",nil)
	var_Items:AddBar(h,"Task",SToD("20010108"),SToD("20010112"),"A3",nil)
oDCOCX_Exontrol1:EndUpdate()
|
|
1252
|
Is it possible display numbers in the same format no matter of regional settings in the control panel
local var_Items as IItems
local h as USUAL

oDCOCX_Exontrol1:BeginUpdate()
oDCOCX_Exontrol1:Chart:[PaneWidth,true] := 0
IColumn{oDCOCX_Exontrol1:Columns:Add("Def")}:[Def,exCellValueFormat] := 1
var_Items := oDCOCX_Exontrol1:Items
	h := var_Items:AddItem(100000.27)
	var_Items:[FormatCell,h,0] := "(value format '') +  ' <fgcolor=808080>(default positive)'"
	h := var_Items:AddItem(100000.27)
	var_Items:[FormatCell,h,0] := "(value format '2|.|3|,|1|1')"
	h := var_Items:AddItem(-100000.27)
	var_Items:[FormatCell,h,0] := "(value format '') +  ' <fgcolor=808080>(default negative)'"
	h := var_Items:AddItem(-100000.27)
	var_Items:[FormatCell,h,0] := "(value format '2|.|3|,|1|1')"
oDCOCX_Exontrol1:EndUpdate()
|
|
1251
|
Is it possible to add a 0 for numbers less than 1 instead .7 to show 0.8
local var_Items as IItems
local h as USUAL

oDCOCX_Exontrol1:BeginUpdate()
oDCOCX_Exontrol1:Chart:[PaneWidth,true] := 0
IColumn{oDCOCX_Exontrol1:Columns:Add("Def")}:[Def,exCellValueFormat] := 1
var_Items := oDCOCX_Exontrol1:Items
	h := var_Items:AddItem(0.27)
	var_Items:[FormatCell,h,0] := "(value format '') +  ' <fgcolor=808080>(default)'"
	h := var_Items:AddItem(0.27)
	var_Items:[FormatCell,h,0] := "(value format '|||||0') +  ' <fgcolor=808080>(Display no leading zeros)'"
oDCOCX_Exontrol1:EndUpdate()
|
|
1250
|
How can I specify the format for negative numbers
local var_Items as IItems
local h as USUAL

oDCOCX_Exontrol1:BeginUpdate()
oDCOCX_Exontrol1:Chart:[PaneWidth,true] := 0
IColumn{oDCOCX_Exontrol1:Columns:Add("Def")}:[Def,exCellValueFormat] := 1
var_Items := oDCOCX_Exontrol1:Items
	h := var_Items:AddItem(-100000.27)
	var_Items:[FormatCell,h,0] := "(value format '') +  ' <fgcolor=808080>(default)'"
	h := var_Items:AddItem(-100000.27)
	var_Items:[FormatCell,h,0] := "(value format '||||1') +  ' <fgcolor=808080>(Negative sign, number; for example, -1.1)'"
oDCOCX_Exontrol1:EndUpdate()
|
|
1249
|
Is it possible to change the grouping character when display numbers
local var_Items as IItems
local h as USUAL

oDCOCX_Exontrol1:BeginUpdate()
oDCOCX_Exontrol1:Chart:[PaneWidth,true] := 0
IColumn{oDCOCX_Exontrol1:Columns:Add("Def")}:[Def,exCellValueFormat] := 1
var_Items := oDCOCX_Exontrol1:Items
	h := var_Items:AddItem(100000.27)
	var_Items:[FormatCell,h,0] := "(value format '') +  ' <fgcolor=808080>(default)'"
	h := var_Items:AddItem(100000.27)
	var_Items:[FormatCell,h,0] := "(value format '|||-') +  ' <fgcolor=808080>(grouping character is -)'"
oDCOCX_Exontrol1:EndUpdate()
|
|
1248
|
How can I display numbers with 2 digits in each group
local var_Items as IItems
local h as USUAL

oDCOCX_Exontrol1:BeginUpdate()
oDCOCX_Exontrol1:Chart:[PaneWidth,true] := 0
IColumn{oDCOCX_Exontrol1:Columns:Add("Def")}:[Def,exCellValueFormat] := 1
var_Items := oDCOCX_Exontrol1:Items
	h := var_Items:AddItem(100000.27)
	var_Items:[FormatCell,h,0] := "(value format '') +  ' <fgcolor=808080>(default)'"
	h := var_Items:AddItem(100000.27)
	var_Items:[FormatCell,h,0] := "(value format '||2') +  ' <fgcolor=808080>(grouping by 2 digits)'"
oDCOCX_Exontrol1:EndUpdate()
|
|
1247
|
How can I display my numbers using a different decimal separator
local var_Items as IItems
local h as USUAL

oDCOCX_Exontrol1:BeginUpdate()
oDCOCX_Exontrol1:Chart:[PaneWidth,true] := 0
IColumn{oDCOCX_Exontrol1:Columns:Add("Def")}:[Def,exCellValueFormat] := 1
var_Items := oDCOCX_Exontrol1:Items
	h := var_Items:AddItem(100.27)
	var_Items:[FormatCell,h,0] := "(value format '') +  ' <fgcolor=808080>(default)'"
	h := var_Items:AddItem(100.27)
	var_Items:[FormatCell,h,0] := "(value format '|;') +  ' <fgcolor=808080>(decimal separator is <b>;</b>)'"
oDCOCX_Exontrol1:EndUpdate()
|
|
1246
|
Is it possible to display the numbers using 3 (three) digits
local var_Items as IItems
local h as USUAL

oDCOCX_Exontrol1:BeginUpdate()
oDCOCX_Exontrol1:Chart:[PaneWidth,true] := 0
IColumn{oDCOCX_Exontrol1:Columns:Add("Def")}:[Def,exCellValueFormat] := 1
var_Items := oDCOCX_Exontrol1:Items
	h := var_Items:AddItem(100.27)
	var_Items:[FormatCell,h,0] := "(value format '') +  ' <fgcolor=808080>(default)'"
	h := var_Items:AddItem(100.27)
	var_Items:[FormatCell,h,0] := "(value format '3') +  ' <fgcolor=808080>(3 digits)'"
	h := var_Items:AddItem(100.27)
	var_Items:[FormatCell,h,0] := "(value format 2) +  '  <fgcolor=808080>(2 digits)'"
	h := var_Items:AddItem(100.27)
	var_Items:[FormatCell,h,0] := "(value format 1) +  ' <fgcolor=808080>(1 digit)'"
oDCOCX_Exontrol1:EndUpdate()
|
|
1245
|
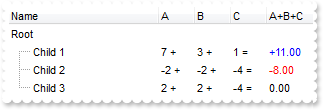
Is it possible to format numbers
local var_Column,var_Column1,var_Column2,var_Column3 as IColumn
local var_Columns as IColumns
local var_Items as IItems
local h,h1 as USUAL
oDCOCX_Exontrol1:BeginUpdate()
oDCOCX_Exontrol1:MarkSearchColumn := false
oDCOCX_Exontrol1:SelBackColor := oDCOCX_Exontrol1:BackColor
oDCOCX_Exontrol1:SelForeColor := oDCOCX_Exontrol1:ForeColor
oDCOCX_Exontrol1:ShowFocusRect := true
oDCOCX_Exontrol1:Chart:[PaneWidth,true] := 0
var_Columns := oDCOCX_Exontrol1:Columns
var_Columns:Add("Name")
var_Column := IColumn{var_Columns:Add("A")}
var_Column:SortType := SortNumeric
var_Column:AllowSizing := false
var_Column:Width := 36
var_Column:FormatColumn := "len(value) ? value + ' +'"
var_Column:Editor:EditType := SpinType
var_Column1 := IColumn{var_Columns:Add("B")}
var_Column1:SortType := SortNumeric
var_Column1:AllowSizing := false
var_Column1:Width := 36
var_Column1:FormatColumn := "len(value) ? value + ' +'"
var_Column1:Editor:EditType := SpinType
var_Column2 := IColumn{var_Columns:Add("C")}
var_Column2:SortType := SortNumeric
var_Column2:AllowSizing := false
var_Column2:Width := 36
var_Column2:FormatColumn := "len(value) ? value + ' ='"
var_Column2:Editor:EditType := SpinType
var_Column3 := IColumn{var_Columns:Add("A+B+C")}
var_Column3:SortType := SortNumeric
var_Column3:Width := 64
var_Column3:ComputedField := "dbl(%1)+dbl(%2)+dbl(%3)"
var_Column3:FormatColumn := "type(value) in (0,1) ? 'null' : ( dbl(value)<0 ? '<fgcolor=FF0000>'+ (value format '2|.|3|,|1' ) : (dbl(value)>0 ? '<fgcolor=0000FF>+'+(value format '2|.|3|,' ): '0.00') )"
var_Column3:[Def,exCellValueFormat] := 1
var_Items := oDCOCX_Exontrol1:Items
h := var_Items:AddItem("Root")
var_Items:[CellValueFormat,h,4] := exComputedField
h1 := var_Items:InsertItem(h,nil,"Child 1")
var_Items:[CellValue,h1,1] := 7
var_Items:[CellValue,h1,2] := 3
var_Items:[CellValue,h1,3] := 1
h1 := var_Items:InsertItem(h,nil,"Child 2")
var_Items:[CellValue,h1,1] := -2
var_Items:[CellValue,h1,2] := -2
var_Items:[CellValue,h1,3] := -4
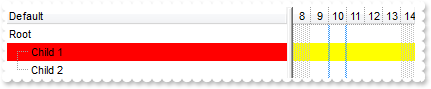
h1 := var_Items:InsertItem(h,nil,"Child 3")
var_Items:[CellValue,h1,1] := 2
var_Items:[CellValue,h1,2] := 2
var_Items:[CellValue,h1,3] := -4
var_Items:[ExpandItem,h] := true
oDCOCX_Exontrol1:EndUpdate()
|
|
1244
|
How can I show the tooltip programmatically ( I want to be able to set the tooltip content dynamically just before the tooltip start to appear, not using the exBarTooltip )
METHOD OCX_Exontrol1MouseMove(Button, Shift, X, Y) CLASS MainDialog
	// MouseMove event - Occurs when the user moves the mouse.
	oDCOCX_Exontrol1:ShowToolTip(oDCOCX_Exontrol1:Chart:[BarFromPoint,-1,-1],"",2,"4","-4")
RETURN NIL

local var_Chart as IChart
local var_Items as IItems
local h as USUAL

oDCOCX_Exontrol1:BeginUpdate()
oDCOCX_Exontrol1:Columns:Add("Def")
var_Chart := oDCOCX_Exontrol1:Chart
	var_Chart:AllowCreateBar := exNoCreateBar
	var_Chart:[PaneWidth,false] := 64
	var_Chart:LevelCount := 2
	var_Chart:FirstVisibleDate := SToD("20100101")
var_Items := oDCOCX_Exontrol1:Items
	h := var_Items:AddItem("Task")
	var_Items:AddBar(h,"Task",SToD("20100102"),SToD("20100105"),"A","A")
	var_Items:AddBar(h,"Task",SToD("20100105"),SToD("20100108"),"B","B")
	var_Items:AddBar(h,"Task",SToD("20100108"),SToD("20100111"),"C","C")
	var_Items:GroupBars(h,"A",false,h,"B",true,39,nil)
	var_Items:GroupBars(h,"B",false,h,"C",true,39,nil)
oDCOCX_Exontrol1:EndUpdate()
|
|
1243
|
How can I set the column's width to my desired width
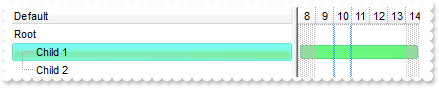
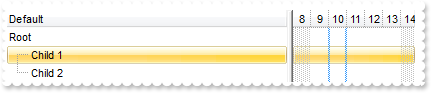
local var_Columns as IColumns

oDCOCX_Exontrol1:ColumnAutoResize := false
var_Columns := oDCOCX_Exontrol1:Columns
	IColumn{var_Columns:Add("A")}:Width := 128
	IColumn{var_Columns:Add("B")}:Width := 128
oDCOCX_Exontrol1:DrawGridLines := exAllLines
|
|
1242
|
Is it possible to prevent intersection of three bars or more
local var_Chart as IChart
local var_Items as IItems
local h as USUAL

oDCOCX_Exontrol1:BeginUpdate()
oDCOCX_Exontrol1:Columns:Add("Def")
var_Chart := oDCOCX_Exontrol1:Chart
	var_Chart:AllowCreateBar := exNoCreateBar
	var_Chart:[PaneWidth,false] := 64
	var_Chart:LevelCount := 2
	var_Chart:FirstVisibleDate := SToD("20100101")
var_Items := oDCOCX_Exontrol1:Items
	h := var_Items:AddItem("Task")
	var_Items:AddBar(h,"Task",SToD("20100102"),SToD("20100105"),"A","A")
	var_Items:AddBar(h,"Task",SToD("20100105"),SToD("20100108"),"B","B")
	var_Items:AddBar(h,"Task",SToD("20100108"),SToD("20100111"),"C","C")
	var_Items:GroupBars(h,"A",false,h,"B",true,39,nil)
	var_Items:GroupBars(h,"B",false,h,"C",true,39,nil)
oDCOCX_Exontrol1:EndUpdate()
|
|
1241
|
Is it possible to prevent intersection of two bars
local var_Chart as IChart
local var_Items as IItems
local h as USUAL

oDCOCX_Exontrol1:BeginUpdate()
oDCOCX_Exontrol1:Columns:Add("Def")
var_Chart := oDCOCX_Exontrol1:Chart
	var_Chart:AllowCreateBar := exNoCreateBar
	var_Chart:[PaneWidth,false] := 64
	var_Chart:LevelCount := 2
	var_Chart:FirstVisibleDate := SToD("20100101")
var_Items := oDCOCX_Exontrol1:Items
	h := var_Items:AddItem("Task")
	var_Items:AddBar(h,"Task",SToD("20100102"),SToD("20100105"),"A","A")
	var_Items:AddBar(h,"Task",SToD("20100105"),SToD("20100108"),"B","B")
	var_Items:GroupBars(h,"A",false,h,"B",true,39,nil)
oDCOCX_Exontrol1:EndUpdate()
|
|
1240
|
Is it possible to specify the cell's value but still want to display some formatted text instead the value
local var_Items as IItems
local h as USUAL

oDCOCX_Exontrol1:BeginUpdate()
oDCOCX_Exontrol1:Chart:[PaneWidth,true] := 0
oDCOCX_Exontrol1:Columns:Add("Value")
oDCOCX_Exontrol1:Columns:Add("FormatCell")
var_Items := oDCOCX_Exontrol1:Items
	h := var_Items:AddItem(1)
	var_Items:[CellValue,h,1] := 12
	var_Items:[FormatCell,h,1] := "currency(value)"
	h := var_Items:AddItem(SToD("20010101"))
	var_Items:[CellValue,h,1] := SToD("20010101")
	var_Items:[CellValueFormat,h,1] := exHTML
	var_Items:[FormatCell,h,1] := "longdate(value) replace '2001' with '<b>2001</b>'"
oDCOCX_Exontrol1:EndUpdate()
|
|
1239
|
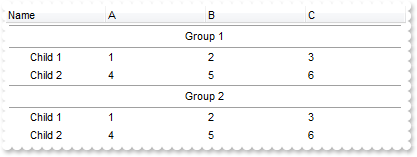
How can I simulate displaying groups
local var_Columns as IColumns
local var_Items as IItems
local h,h1 as USUAL

oDCOCX_Exontrol1:HasLines := exNoLine
oDCOCX_Exontrol1:ScrollBySingleLine := true
oDCOCX_Exontrol1:Chart:[PaneWidth,true] := 0
var_Columns := oDCOCX_Exontrol1:Columns
	var_Columns:Add("Name")
	var_Columns:Add("A")
	var_Columns:Add("B")
	var_Columns:Add("C")
var_Items := oDCOCX_Exontrol1:Items
	h := var_Items:AddItem("Group 1")
	var_Items:[CellHAlignment,h,0] := CenterAlignment
	var_Items:[ItemDivider,h] := 0
	var_Items:[ItemDividerLineAlignment,h] := DividerBoth
	var_Items:[ItemHeight,h] := 24
	var_Items:[SortableItem,h] := false
	h1 := var_Items:InsertItem(h,nil,"Child 1")
	var_Items:[CellValue,h1,1] := 1
	var_Items:[CellValue,h1,2] := 2
	var_Items:[CellValue,h1,3] := 3
	h1 := var_Items:InsertItem(h,nil,"Child 2")
	var_Items:[CellValue,h1,1] := 4
	var_Items:[CellValue,h1,2] := 5
	var_Items:[CellValue,h1,3] := 6
	var_Items:[ExpandItem,h] := true
	h := var_Items:AddItem("Group 2")
	var_Items:[CellHAlignment,h,0] := CenterAlignment
	var_Items:[ItemDivider,h] := 0
	var_Items:[ItemDividerLineAlignment,h] := DividerBoth
	var_Items:[ItemHeight,h] := 24
	var_Items:[SortableItem,h] := false
	h1 := var_Items:InsertItem(h,nil,"Child 1")
	var_Items:[CellValue,h1,1] := 1
	var_Items:[CellValue,h1,2] := 2
	var_Items:[CellValue,h1,3] := 3
	h1 := var_Items:InsertItem(h,nil,"Child 2")
	var_Items:[CellValue,h1,1] := 4
	var_Items:[CellValue,h1,2] := 5
	var_Items:[CellValue,h1,3] := 6
	var_Items:[ExpandItem,h] := true
|
|
1238
|
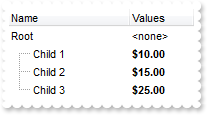
Is it possible to specify the cell's value but still want to display some formatted text instead the value
local var_Column as IColumn
local var_Columns as IColumns
local var_Items as IItems
local h as USUAL

oDCOCX_Exontrol1:BeginUpdate()
oDCOCX_Exontrol1:Chart:[PaneWidth,true] := 0
oDCOCX_Exontrol1:MarkSearchColumn := false
var_Columns := oDCOCX_Exontrol1:Columns
	var_Columns:Add("Name")
	var_Column := IColumn{var_Columns:Add("Values")}
		var_Column:SortType := SortNumeric
		var_Column:AllowSizing := false
		var_Column:Width := 64
		var_Column:FormatColumn := "((0:=dbl(value)) < 10? '<fgcolor=808080><font ;7>' :'<b>') + currency(=:0)"
		var_Column:[Def,exCellValueFormat] := 1
var_Items := oDCOCX_Exontrol1:Items
	h := var_Items:AddItem("Root")
	var_Items:[FormatCell,h,1] := "'<none>'"
	var_Items:[CellValue,var_Items:InsertItem(h,nil,"Child 1"),1] := 10
	var_Items:[CellValue,var_Items:InsertItem(h,nil,"Child 2"),1] := 15
	var_Items:[CellValue,var_Items:InsertItem(h,nil,"Child 3"),1] := 25
	var_Items:[ExpandItem,h] := true
oDCOCX_Exontrol1:EndUpdate()
|
|
1237
|
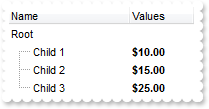
I am using the FormatColumn to display the current currency, but would like hide some values. Is it possible
local var_Column as IColumn
local var_Columns as IColumns
local var_Items as IItems
local h as USUAL

oDCOCX_Exontrol1:BeginUpdate()
oDCOCX_Exontrol1:Chart:[PaneWidth,true] := 0
oDCOCX_Exontrol1:MarkSearchColumn := false
var_Columns := oDCOCX_Exontrol1:Columns
	var_Columns:Add("Name")
	var_Column := IColumn{var_Columns:Add("Values")}
		var_Column:SortType := SortNumeric
		var_Column:AllowSizing := false
		var_Column:Width := 64
		var_Column:FormatColumn := "((0:=dbl(value)) < 10? '<fgcolor=808080><font ;7>' :'<b>') + currency(=:0)"
		var_Column:[Def,exCellValueFormat] := 1
var_Items := oDCOCX_Exontrol1:Items
	h := var_Items:AddItem("Root")
	var_Items:[FormatCell,h,1] := " "
	var_Items:[CellValue,var_Items:InsertItem(h,nil,"Child 1"),1] := 10
	var_Items:[CellValue,var_Items:InsertItem(h,nil,"Child 2"),1] := 15
	var_Items:[CellValue,var_Items:InsertItem(h,nil,"Child 3"),1] := 25
	var_Items:[ExpandItem,h] := true
oDCOCX_Exontrol1:EndUpdate()
|
|
1236
|
I have a right-aligned column with check-boxes with no text, but it is not perfectly aligned. Is there something I can do
local var_Column,var_Column1 as IColumn
local var_Columns as IColumns
local var_Items as IItems

oDCOCX_Exontrol1:BeginUpdate()
oDCOCX_Exontrol1:TreeColumnIndex := -1
oDCOCX_Exontrol1:DrawGridLines := exAllLines
oDCOCX_Exontrol1:ShowFocusRect := false
var_Columns := oDCOCX_Exontrol1:Columns
	var_Column := IColumn{var_Columns:Add("Default-Right")}
		var_Column:[Def,exCellHasCheckBox] := true
		var_Column:Alignment := RightAlignment
		var_Column:HeaderAlignment := RightAlignment
	var_Column1 := IColumn{var_Columns:Add("Custom-Right")}
		var_Column1:[Def,exCellHasCheckBox] := true
		var_Column1:[Def,exCellDrawPartsOrder] := "icon,icons,picture,caption,check"
		var_Column1:HeaderAlignment := RightAlignment
		var_Column1:Alignment := RightAlignment
var_Items := oDCOCX_Exontrol1:Items
	var_Items:AddItem(nil)
	var_Items:AddItem(nil)
	var_Items:AddItem(nil)
oDCOCX_Exontrol1:EndUpdate()
|
|
1235
|
How can I specify that once I move or resize a bar other should be automatically moved/resized
local var_Chart as IChart
local var_Items as IItems
local h1,h2 as USUAL

oDCOCX_Exontrol1:BeginUpdate()
oDCOCX_Exontrol1:MarkSearchColumn := false
oDCOCX_Exontrol1:Columns:Add("Tasks")
IColumn{oDCOCX_Exontrol1:Columns:Add("Start")}:Visible := false
IColumn{oDCOCX_Exontrol1:Columns:Add("End")}:Visible := false
var_Chart := oDCOCX_Exontrol1:Chart
	var_Chart:FirstVisibleDate := SToD("20060920")
	var_Chart:[PaneWidth,false] := 64
var_Items := oDCOCX_Exontrol1:Items
	h1 := var_Items:AddItem("Item 1")
	var_Items:[CellValue,h1,1] := SToD("20060921")
	var_Items:[CellValue,h1,2] := SToD("20060924")
	var_Items:AddBar(h1,"Task",var_Items:[CellValue,h1,1],var_Items:[CellValue,h1,2],"",nil)
	h2 := var_Items:AddItem("Item 2")
	var_Items:[CellValue,h2,1] := SToD("20060921")
	var_Items:[CellValue,h2,2] := SToD("20060924")
	var_Items:AddBar(h2,"Task",var_Items:[CellValue,h2,1],var_Items:[CellValue,h2,2],"",nil)
	var_Items:GroupBars(h1,"",true,h2,"",true,nil,nil)
	var_Items:GroupBars(h1,"",false,h2,"",false,nil,nil)
oDCOCX_Exontrol1:EndUpdate()
|
|
1234
|
How can I specify that once I move a bar other should be automatically moved
local var_Chart as IChart
local var_Items as IItems
local h1,h2 as USUAL

oDCOCX_Exontrol1:BeginUpdate()
oDCOCX_Exontrol1:MarkSearchColumn := false
oDCOCX_Exontrol1:Columns:Add("Tasks")
IColumn{oDCOCX_Exontrol1:Columns:Add("Start")}:Visible := false
IColumn{oDCOCX_Exontrol1:Columns:Add("End")}:Visible := false
var_Chart := oDCOCX_Exontrol1:Chart
	var_Chart:FirstVisibleDate := SToD("20060920")
	var_Chart:[PaneWidth,false] := 64
var_Items := oDCOCX_Exontrol1:Items
	h1 := var_Items:AddItem("Item 1")
	var_Items:[CellValue,h1,1] := SToD("20060921")
	var_Items:[CellValue,h1,2] := SToD("20060924")
	var_Items:AddBar(h1,"Task",var_Items:[CellValue,h1,1],var_Items:[CellValue,h1,2],"",nil)
	h2 := var_Items:AddItem("Item 2")
	var_Items:[CellValue,h2,1] := SToD("20060921")
	var_Items:[CellValue,h2,2] := SToD("20060924")
	var_Items:AddBar(h2,"Task",var_Items:[CellValue,h2,1],var_Items:[CellValue,h2,2],"",nil)
	var_Items:GroupBars(h1,"",true,h2,"",true,3,nil)
oDCOCX_Exontrol1:EndUpdate()
|
|
1233
|
Is it possible to include the bar's caption in overlaying
local var_Bar as IBar
local var_Chart as IChart
local var_Items as IItems
local h as USUAL

oDCOCX_Exontrol1:BeginUpdate()
oDCOCX_Exontrol1:ScrollBySingleLine := true
oDCOCX_Exontrol1:Columns:Add("Task")
oDCOCX_Exontrol1:DrawGridLines := exHLines
var_Chart := oDCOCX_Exontrol1:Chart
	var_Chart:DrawGridLines := exHLines
	var_Chart:AllowCreateBar := exCreateBarAuto
	var_Chart:AllowLinkBars := false
	var_Chart:ResizeUnitScale := exHour
	var_Chart:[PaneWidth,false] := 48
	var_Chart:FirstVisibleDate := SToD("20010101")
	var_Bar := var_Chart:Bars:[Item,"Task"]
		var_Bar:OverlaidType := exOverlaidBarsIncludeCaption | exOverlaidBarsStackAutoArrange | exOverlaidBarsStack
		var_Bar:OverlaidGroup := "Milestone"
var_Items := oDCOCX_Exontrol1:Items
	h := var_Items:AddItem("Task 1")
	var_Items:AddBar(h,"Task",SToD("20010102"),SToD("20010104"),"A1","task")
	var_Items:[ItemBar,h,"A1",exBarHAlignCaption] := 18
	var_Items:AddBar(h,"Milestone",SToD("20010103"),SToD("20010103"),"M","milestone")
	var_Items:[ItemBar,h,"M",exBarHAlignCaption] := 18
	h := var_Items:AddItem("Task 2")
	var_Items:AddBar(h,"Task",SToD("20010108"),SToD("20010112"),"A1","task")
	var_Items:[ItemBar,h,"A1",exBarHAlignCaption] := 18
	var_Items:AddBar(h,"Milestone",SToD("20010108"),SToD("20010108"),"M","milestone")
	var_Items:[ItemBar,h,"M",exBarHAlignCaption] := 18
oDCOCX_Exontrol1:EndUpdate()
|
|
1232
|
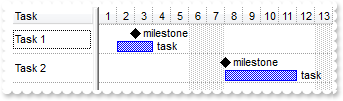
Sometimes, the milestone bars are not overlaying the task bars. What I am doing wrong
local var_Bar as IBar
local var_Chart as IChart
local var_Items as IItems
local h as USUAL

oDCOCX_Exontrol1:BeginUpdate()
oDCOCX_Exontrol1:ScrollBySingleLine := true
oDCOCX_Exontrol1:Columns:Add("Task")
oDCOCX_Exontrol1:DrawGridLines := exHLines
var_Chart := oDCOCX_Exontrol1:Chart
	var_Chart:DrawGridLines := exHLines
	var_Chart:AllowCreateBar := exCreateBarAuto
	var_Chart:AllowLinkBars := false
	var_Chart:ResizeUnitScale := exHour
	var_Chart:[PaneWidth,false] := 48
	var_Chart:FirstVisibleDate := SToD("20010101")
	var_Bar := var_Chart:Bars:[Item,"Task"]
		var_Bar:OverlaidType := exOverlaidBarsIncludeCaption | exOverlaidBarsStackAutoArrange | exOverlaidBarsStack
		var_Bar:OverlaidGroup := "Milestone"
var_Items := oDCOCX_Exontrol1:Items
	h := var_Items:AddItem("Task 1")
	var_Items:AddBar(h,"Task",SToD("20010102"),SToD("20010104"),"A1",nil)
	var_Items:AddBar(h,"Milestone",SToD("20010103"),SToD("20010103"),"M",nil)
	h := var_Items:AddItem("Task 2")
	var_Items:AddBar(h,"Task",SToD("20010107"),SToD("20010110"),"A1",nil)
	var_Items:AddBar(h,"Milestone",SToD("20010108"),SToD("20010108"),"M",nil)
oDCOCX_Exontrol1:EndUpdate()
|
|
1231
|
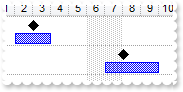
Is it possible to add milestone bars in the same overlaid group as task is
local var_Bar as IBar
local var_Chart as IChart
local var_Items as IItems
local h as USUAL

oDCOCX_Exontrol1:BeginUpdate()
oDCOCX_Exontrol1:ScrollBySingleLine := true
oDCOCX_Exontrol1:Columns:Add("Task")
oDCOCX_Exontrol1:DrawGridLines := exHLines
var_Chart := oDCOCX_Exontrol1:Chart
	var_Chart:DrawGridLines := exHLines
	var_Chart:AllowCreateBar := exCreateBarAuto
	var_Chart:AllowLinkBars := false
	var_Chart:ResizeUnitScale := exHour
	var_Chart:[PaneWidth,false] := 48
	var_Chart:FirstVisibleDate := SToD("20010101")
	var_Bar := var_Chart:Bars:[Item,"Task"]
		var_Bar:OverlaidType := exOverlaidBarsStackAutoArrange | exOverlaidBarsStack
		var_Bar:OverlaidGroup := "Milestone"
var_Items := oDCOCX_Exontrol1:Items
	h := var_Items:AddItem("Task 1")
	var_Items:AddBar(h,"Task",SToD("20010102"),SToD("20010104"),"A1",nil)
	var_Items:AddBar(h,"Milestone",SToD("20010103"),SToD("20010103"),"M",nil)
	h := var_Items:AddItem("Task 2")
	var_Items:AddBar(h,"Task",SToD("20010107"),SToD("20010110"),"A1",nil)
	var_Items:AddBar(h,"Milestone",SToD("20010108"),SToD("20010108"),"M",nil)
oDCOCX_Exontrol1:EndUpdate()
|
|
1230
|
When adding a date column and setting the SortType to SortTypeEnum.SortDateTime, the column still sorts as a string. What am I doing wrong
local var_Items as IItems
local h as USUAL

oDCOCX_Exontrol1:BeginUpdate()
IColumn{oDCOCX_Exontrol1:Columns:Add("Date")}:SortType := SortDateTime
oDCOCX_Exontrol1:Columns:Add("String")
var_Items := oDCOCX_Exontrol1:Items
	h := var_Items:AddItem(SToD("20010101"))
	var_Items:[CellValue,h,1] := var_Items:[CellValue,h,0]
	h := var_Items:AddItem(SToD("20010111"))
	var_Items:[CellValue,h,1] := var_Items:[CellValue,h,0]
	h := var_Items:AddItem(SToD("20010102"))
	var_Items:[CellValue,h,1] := var_Items:[CellValue,h,0]
oDCOCX_Exontrol1:Columns:[Item,0]:SortOrder := SortDescending
oDCOCX_Exontrol1:EndUpdate()
|
|
1229
|
Is it possible to move an item from a parent to another
local var_Items as IItems

oDCOCX_Exontrol1:BeginUpdate()
oDCOCX_Exontrol1:LinesAtRoot := exLinesAtRoot
oDCOCX_Exontrol1:Columns:Add("Items")
var_Items := oDCOCX_Exontrol1:Items
	var_Items:AddItem("A")
	var_Items:AddItem("B")
	var_Items:InsertItem(var_Items:AddItem("C"),"","D")
	var_Items:SetParent(var_Items:[FindItem,"D",0,nil],var_Items:[FindItem,"A",0,nil])
oDCOCX_Exontrol1:EndUpdate()
|
|
1228
|
How can I change the identation for an item
local var_Items as IItems

oDCOCX_Exontrol1:BeginUpdate()
oDCOCX_Exontrol1:LinesAtRoot := exLinesAtRoot
oDCOCX_Exontrol1:Columns:Add("Items")
var_Items := oDCOCX_Exontrol1:Items
	var_Items:AddItem("A")
	var_Items:AddItem("B")
	var_Items:InsertItem(var_Items:AddItem("C"),"","D")
	var_Items:SetParent(var_Items:[FindItem,"D",0,nil],0)
oDCOCX_Exontrol1:EndUpdate()
|
|
1227
|
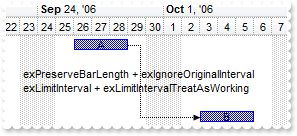
Moving the bars fail if I am using GroupBars, exBarCanResize on 0 and exBarKeepWorkingCount on True ( bars keeps the working units and at runtime user can not resize them ). Is it possible to use the GroupBars while user should not be able to resize the bars at runtime
local var_Chart as IChart
local var_Items as IItems
local h1,h2 as USUAL

oDCOCX_Exontrol1:BeginUpdate()
oDCOCX_Exontrol1:Columns:Add("Tasks")
var_Chart := oDCOCX_Exontrol1:Chart
	var_Chart:FirstVisibleDate := SToD("20060920")
	var_Chart:[PaneWidth,false] := 48
	var_Chart:LevelCount := 2
	var_Chart:Bars:Add("Task:Split"):Shortcut := "Task"
var_Items := oDCOCX_Exontrol1:Items
	h1 := var_Items:AddItem("Task 1")
	var_Items:AddBar(h1,"Task",SToD("20060926"),SToD("20060929"),"","A")
	var_Items:[ItemBar,h1,"",exBarKeepWorkingCount] := true
	var_Items:[ItemBar,h1,"",exBarCanResize] := 4
	var_Items:AddItem("")
	var_Items:AddItem("")
	var_Items:AddItem("")
	h2 := var_Items:AddItem("Task 2")
	var_Items:AddBar(h2,"Task",SToD("20060926"),SToD("20060929"),"","B")
	var_Items:[ItemBar,h2,"",exBarKeepWorkingCount] := true
	var_Items:[ItemBar,h2,"",exBarCanResize] := 4
	var_Items:AddLink("L1",h1,"",h2,"")
	var_Items:[Link,"L1",exLinkStartPos] := 2
	var_Items:[Link,"L1",exLinkEndPos] := 0
	var_Items:[Link,"L1",exLinkText] := "exPreserveBarLength + exIgnoreOriginalInterval<br>exLimitInterval + exLimitIntervalTreatAsWorking"
	var_Items:GroupBars(h1,"",false,h2,"",true,95,"2")
oDCOCX_Exontrol1:EndUpdate()
|
|
1226
|
How can I collapse all items
local var_Items as IItems
local h as USUAL

oDCOCX_Exontrol1:BeginUpdate()
oDCOCX_Exontrol1:LinesAtRoot := exLinesAtRoot
oDCOCX_Exontrol1:Columns:Add("Items")
var_Items := oDCOCX_Exontrol1:Items
	h := var_Items:AddItem("Root 1")
	var_Items:InsertItem(h,nil,"Child 1")
	var_Items:InsertItem(h,nil,"Child 2")
	h := var_Items:AddItem("Root 2")
	var_Items:InsertItem(h,nil,"Child 1")
	var_Items:InsertItem(h,nil,"Child 2")
	var_Items:[ExpandItem,0] := false
oDCOCX_Exontrol1:EndUpdate()
|
|
1225
|
How can I expand all items
local var_Items as IItems
local h as USUAL

oDCOCX_Exontrol1:BeginUpdate()
oDCOCX_Exontrol1:LinesAtRoot := exLinesAtRoot
oDCOCX_Exontrol1:Columns:Add("Items")
var_Items := oDCOCX_Exontrol1:Items
	h := var_Items:AddItem("Root 1")
	var_Items:InsertItem(h,nil,"Child 1")
	var_Items:InsertItem(h,nil,"Child 2")
	h := var_Items:AddItem("Root 2")
	var_Items:InsertItem(h,nil,"Child 1")
	var_Items:InsertItem(h,nil,"Child 2")
	var_Items:[ExpandItem,0] := true
oDCOCX_Exontrol1:EndUpdate()
|
|
1224
|
How can I specify the distance between bars to be in a specified range of working units
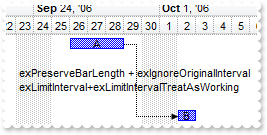
local var_Chart as IChart
local var_Items as IItems
local h1,h2 as USUAL

oDCOCX_Exontrol1:BeginUpdate()
oDCOCX_Exontrol1:Columns:Add("Tasks")
var_Chart := oDCOCX_Exontrol1:Chart
	var_Chart:FirstVisibleDate := SToD("20060920")
	var_Chart:[PaneWidth,false] := 48
	var_Chart:LevelCount := 2
	var_Chart:Bars:Add("Task:Split"):Shortcut := "Task"
var_Items := oDCOCX_Exontrol1:Items
	h1 := var_Items:AddItem("Task 1")
	var_Items:AddBar(h1,"Task",SToD("20060926"),SToD("20060929"),"","A")
	var_Items:AddItem("")
	var_Items:AddItem("")
	var_Items:AddItem("")
	h2 := var_Items:AddItem("Task 2")
	var_Items:AddBar(h2,"Task",SToD("20060926"),SToD("20060929"),"","B")
	var_Items:AddLink("L1",h1,"",h2,"")
	var_Items:[Link,"L1",exLinkStartPos] := 2
	var_Items:[Link,"L1",exLinkEndPos] := 0
	var_Items:[Link,"L1",exLinkText] := "exPreserveBarLength + exIgnoreOriginalInterval<br>exLimitInterval+exLimitIntervalTreatAsWorking"
	var_Items:GroupBars(h1,"",false,h2,"",true,95,"0;1;5")
	var_Items:[ItemBar,0,"<*>",exBarKeepWorkingCount] := true
oDCOCX_Exontrol1:EndUpdate()
|
|
1223
|
How can I specify the distance between bars to be in a specified range
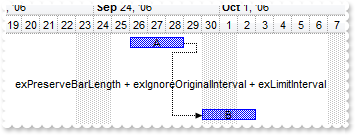
local var_Chart as IChart
local var_Items as IItems
local h1,h2 as USUAL

oDCOCX_Exontrol1:BeginUpdate()
oDCOCX_Exontrol1:Columns:Add("Tasks")
var_Chart := oDCOCX_Exontrol1:Chart
	var_Chart:FirstVisibleDate := SToD("20060920")
	var_Chart:[PaneWidth,false] := 48
	var_Chart:LevelCount := 2
var_Items := oDCOCX_Exontrol1:Items
	h1 := var_Items:AddItem("Task 1")
	var_Items:AddBar(h1,"Task",SToD("20060926"),SToD("20060929"),"","A")
	var_Items:AddItem("")
	var_Items:AddItem("")
	var_Items:AddItem("")
	h2 := var_Items:AddItem("Task 2")
	var_Items:AddBar(h2,"Task",SToD("20060926"),SToD("20060929"),"","B")
	var_Items:AddLink("L1",h1,"",h2,"")
	var_Items:[Link,"L1",exLinkStartPos] := 2
	var_Items:[Link,"L1",exLinkEndPos] := 0
	var_Items:[Link,"L1",exLinkText] := "exPreserveBarLength + exIgnoreOriginalInterval + exLimitInterval"
	var_Items:GroupBars(h1,"",false,h2,"",true,31,"0;1;7")
oDCOCX_Exontrol1:EndUpdate()
|
|
1222
|
How can I specify the distance between bars to be no more than a specified value in working units
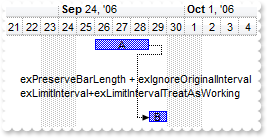
local var_Chart as IChart
local var_Items as IItems
local h1,h2 as USUAL

oDCOCX_Exontrol1:BeginUpdate()
oDCOCX_Exontrol1:Columns:Add("Tasks")
var_Chart := oDCOCX_Exontrol1:Chart
	var_Chart:FirstVisibleDate := SToD("20060920")
	var_Chart:[PaneWidth,false] := 48
	var_Chart:LevelCount := 2
	var_Chart:Bars:Add("Task:Split"):Shortcut := "Task"
var_Items := oDCOCX_Exontrol1:Items
	h1 := var_Items:AddItem("Task 1")
	var_Items:AddBar(h1,"Task",SToD("20060926"),SToD("20060929"),"","A")
	var_Items:AddItem("")
	var_Items:AddItem("")
	var_Items:AddItem("")
	h2 := var_Items:AddItem("Task 2")
	var_Items:AddBar(h2,"Task",SToD("20060926"),SToD("20060929"),"","B")
	var_Items:AddLink("L1",h1,"",h2,"")
	var_Items:[Link,"L1",exLinkStartPos] := 2
	var_Items:[Link,"L1",exLinkEndPos] := 0
	var_Items:[Link,"L1",exLinkText] := "exPreserveBarLength + exIgnoreOriginalInterval<br>exLimitInterval+exLimitIntervalTreatAsWorking"
	var_Items:GroupBars(h1,"",false,h2,"",true,95,"0;0;2")
	var_Items:[ItemBar,0,"<*>",exBarKeepWorkingCount] := true
oDCOCX_Exontrol1:EndUpdate()
|
|
1221
|
How can I specify the distance between bars to be no more than a specified value
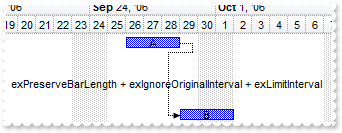
local var_Chart as IChart
local var_Items as IItems
local h1,h2 as USUAL

oDCOCX_Exontrol1:BeginUpdate()
oDCOCX_Exontrol1:Columns:Add("Tasks")
var_Chart := oDCOCX_Exontrol1:Chart
	var_Chart:FirstVisibleDate := SToD("20060920")
	var_Chart:[PaneWidth,false] := 48
	var_Chart:LevelCount := 2
var_Items := oDCOCX_Exontrol1:Items
	h1 := var_Items:AddItem("Task 1")
	var_Items:AddBar(h1,"Task",SToD("20060926"),SToD("20060929"),"","A")
	var_Items:AddItem("")
	var_Items:AddItem("")
	var_Items:AddItem("")
	h2 := var_Items:AddItem("Task 2")
	var_Items:AddBar(h2,"Task",SToD("20060926"),SToD("20060929"),"","B")
	var_Items:AddLink("L1",h1,"",h2,"")
	var_Items:[Link,"L1",exLinkStartPos] := 2
	var_Items:[Link,"L1",exLinkEndPos] := 0
	var_Items:[Link,"L1",exLinkText] := "exPreserveBarLength + exIgnoreOriginalInterval + exLimitInterval"
	var_Items:GroupBars(h1,"",false,h2,"",true,31,"0;0;2")
oDCOCX_Exontrol1:EndUpdate()
|
|
1220
|
How can I specify the distance between bars to be no less than a specified value in working units
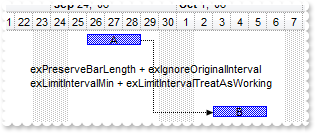
local var_Chart as IChart
local var_Items as IItems
local h1,h2 as USUAL

oDCOCX_Exontrol1:BeginUpdate()
oDCOCX_Exontrol1:Columns:Add("Tasks")
var_Chart := oDCOCX_Exontrol1:Chart
	var_Chart:FirstVisibleDate := SToD("20060920")
	var_Chart:[PaneWidth,false] := 48
	var_Chart:LevelCount := 2
	var_Chart:Bars:Add("Task:Split"):Shortcut := "Task"
var_Items := oDCOCX_Exontrol1:Items
	h1 := var_Items:AddItem("Task 1")
	var_Items:AddBar(h1,"Task",SToD("20060926"),SToD("20060929"),"","A")
	var_Items:AddItem("")
	var_Items:AddItem("")
	var_Items:AddItem("")
	h2 := var_Items:AddItem("Task 2")
	var_Items:AddBar(h2,"Task",SToD("20060926"),SToD("20060929"),"","B")
	var_Items:AddLink("L1",h1,"",h2,"")
	var_Items:[Link,"L1",exLinkStartPos] := 2
	var_Items:[Link,"L1",exLinkEndPos] := 0
	var_Items:[Link,"L1",exLinkText] := "exPreserveBarLength + exIgnoreOriginalInterval<br>exLimitIntervalMin + exLimitIntervalTreatAsWorking"
	var_Items:GroupBars(h1,"",false,h2,"",true,79,"2")
	var_Items:[ItemBar,0,"<*>",exBarKeepWorkingCount] := true
oDCOCX_Exontrol1:EndUpdate()
|
|
1219
|
How can I specify the distance between bars to be no less than a specified value
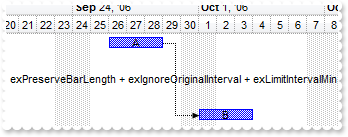
local var_Chart as IChart
local var_Items as IItems
local h1,h2 as USUAL

oDCOCX_Exontrol1:BeginUpdate()
oDCOCX_Exontrol1:Columns:Add("Tasks")
var_Chart := oDCOCX_Exontrol1:Chart
	var_Chart:FirstVisibleDate := SToD("20060920")
	var_Chart:[PaneWidth,false] := 48
	var_Chart:LevelCount := 2
var_Items := oDCOCX_Exontrol1:Items
	h1 := var_Items:AddItem("Task 1")
	var_Items:AddBar(h1,"Task",SToD("20060926"),SToD("20060929"),"","A")
	var_Items:AddItem("")
	var_Items:AddItem("")
	var_Items:AddItem("")
	h2 := var_Items:AddItem("Task 2")
	var_Items:AddBar(h2,"Task",SToD("20060926"),SToD("20060929"),"","B")
	var_Items:AddLink("L1",h1,"",h2,"")
	var_Items:[Link,"L1",exLinkStartPos] := 2
	var_Items:[Link,"L1",exLinkEndPos] := 0
	var_Items:[Link,"L1",exLinkText] := "exPreserveBarLength + exIgnoreOriginalInterval + exLimitIntervalMin"
	var_Items:GroupBars(h1,"",false,h2,"",true,15,"2")
oDCOCX_Exontrol1:EndUpdate()
|
|
1218
|
How do I specify the distance between bars to be exactly the specified value in working units
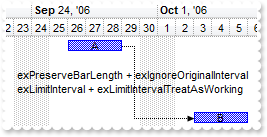
local var_Chart as IChart
local var_Items as IItems
local h1,h2 as USUAL

oDCOCX_Exontrol1:BeginUpdate()
oDCOCX_Exontrol1:Columns:Add("Tasks")
var_Chart := oDCOCX_Exontrol1:Chart
	var_Chart:FirstVisibleDate := SToD("20060920")
	var_Chart:[PaneWidth,false] := 48
	var_Chart:LevelCount := 2
	var_Chart:Bars:Add("Task:Split"):Shortcut := "Task"
var_Items := oDCOCX_Exontrol1:Items
	h1 := var_Items:AddItem("Task 1")
	var_Items:AddBar(h1,"Task",SToD("20060926"),SToD("20060929"),"","A")
	var_Items:AddItem("")
	var_Items:AddItem("")
	var_Items:AddItem("")
	h2 := var_Items:AddItem("Task 2")
	var_Items:AddBar(h2,"Task",SToD("20060926"),SToD("20060929"),"","B")
	var_Items:AddLink("L1",h1,"",h2,"")
	var_Items:[Link,"L1",exLinkStartPos] := 2
	var_Items:[Link,"L1",exLinkEndPos] := 0
	var_Items:[Link,"L1",exLinkText] := "exPreserveBarLength + exIgnoreOriginalInterval<br>exLimitInterval + exLimitIntervalTreatAsWorking"
	var_Items:GroupBars(h1,"",false,h2,"",true,95,"2")
	var_Items:[ItemBar,0,"<*>",exBarKeepWorkingCount] := true
oDCOCX_Exontrol1:EndUpdate()
|
|
1217
|
How do I specify the distance between bars to be exactly the specified value
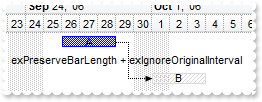
local var_Chart as IChart
local var_Items as IItems
local h1,h2 as USUAL

oDCOCX_Exontrol1:BeginUpdate()
oDCOCX_Exontrol1:Columns:Add("Tasks")
var_Chart := oDCOCX_Exontrol1:Chart
	var_Chart:FirstVisibleDate := SToD("20060920")
	var_Chart:[PaneWidth,false] := 48
	var_Chart:LevelCount := 2
var_Items := oDCOCX_Exontrol1:Items
	h1 := var_Items:AddItem("Task 1")
	var_Items:AddBar(h1,"Task",SToD("20060926"),SToD("20060929"),"","A")
	var_Items:AddItem("")
	h2 := var_Items:AddItem("Task 2")
	var_Items:AddBar(h2,"Unknown",SToD("20060926"),SToD("20060929"),"","B")
	var_Items:AddLink("L1",h1,"",h2,"")
	var_Items:[Link,"L1",exLinkStartPos] := 2
	var_Items:[Link,"L1",exLinkEndPos] := 0
	var_Items:[Link,"L1",exLinkText] := "exPreserveBarLength + exIgnoreOriginalInterval"
	var_Items:GroupBars(h1,"",false,h2,"",true,7,"2")
oDCOCX_Exontrol1:EndUpdate()
|
|
1216
|
How do I specify the day's duration to be working only
local var_Chart as IChart
local var_Items as IItems
local h1 as USUAL

oDCOCX_Exontrol1:BeginUpdate()
oDCOCX_Exontrol1:Columns:Add("Tasks")
oDCOCX_Exontrol1:Chart:Bars:Add("Task:Split"):Shortcut := "Task"
var_Chart := oDCOCX_Exontrol1:Chart
	var_Chart:FirstVisibleDate := SToD("20060920")
	var_Chart:[PaneWidth,false] := 48
	var_Chart:LevelCount := 2
var_Items := oDCOCX_Exontrol1:Items
	h1 := var_Items:AddItem("Task 1")
	var_Items:AddBar(h1,"Task",SToD("20060926"),SToD("20060929"),"A",nil)
	var_Items:[ItemBar,h1,"A",exBarKeepWorkingCount] := true
oDCOCX_Exontrol1:EndUpdate()
|
|
1215
|
How do I specify the the user can't resize the bar at left side ( starting point )
local var_Chart as IChart
local var_Items as IItems
local h1 as USUAL

oDCOCX_Exontrol1:BeginUpdate()
oDCOCX_Exontrol1:Columns:Add("Tasks")
oDCOCX_Exontrol1:Chart:Bars:Add("Task:Split"):Shortcut := "Task"
var_Chart := oDCOCX_Exontrol1:Chart
	var_Chart:FirstVisibleDate := SToD("20060920")
	var_Chart:[PaneWidth,false] := 48
	var_Chart:LevelCount := 2
var_Items := oDCOCX_Exontrol1:Items
	h1 := var_Items:AddItem("Task 1")
	var_Items:AddBar(h1,"Task",SToD("20060926"),SToD("20060929"),"A","not resizable on left")
	var_Items:[ItemBar,h1,"A",exBarKeepWorkingCount] := true
oDCOCX_Exontrol1:EndUpdate()
|
|
1214
|
How do I specify the the user can't resize the bar at left side ( starting point )
local var_Chart as IChart
local var_Items as IItems
local h1 as USUAL

oDCOCX_Exontrol1:BeginUpdate()
oDCOCX_Exontrol1:Columns:Add("Tasks")
var_Chart := oDCOCX_Exontrol1:Chart
	var_Chart:FirstVisibleDate := SToD("20060920")
	var_Chart:[PaneWidth,false] := 48
	var_Chart:LevelCount := 2
var_Items := oDCOCX_Exontrol1:Items
	h1 := var_Items:AddItem("Task 1")
	var_Items:AddBar(h1,"Task",SToD("20060926"),SToD("20060929"),"A","not resizable on left")
	var_Items:[ItemBar,h1,"A",exBarCanResize] := 2
oDCOCX_Exontrol1:EndUpdate()
|
|
1213
|
How do I specify the the user can't resize the bar at right side ( ending point )
local var_Chart as IChart
local var_Items as IItems
local h1 as USUAL

oDCOCX_Exontrol1:BeginUpdate()
oDCOCX_Exontrol1:Columns:Add("Tasks")
var_Chart := oDCOCX_Exontrol1:Chart
	var_Chart:FirstVisibleDate := SToD("20060920")
	var_Chart:[PaneWidth,false] := 48
	var_Chart:LevelCount := 2
var_Items := oDCOCX_Exontrol1:Items
	h1 := var_Items:AddItem("Task 1")
	var_Items:AddBar(h1,"Task",SToD("20060926"),SToD("20060929"),"A","not resizable on right")
	var_Items:[ItemBar,h1,"A",exBarCanResize] := 1
oDCOCX_Exontrol1:EndUpdate()
|
|
1212
|
How do I specify the the user can't resize the bar at runtime
local var_Chart as IChart
local var_Items as IItems
local h1 as USUAL

oDCOCX_Exontrol1:BeginUpdate()
oDCOCX_Exontrol1:Columns:Add("Tasks")
var_Chart := oDCOCX_Exontrol1:Chart
	var_Chart:FirstVisibleDate := SToD("20060920")
	var_Chart:[PaneWidth,false] := 48
	var_Chart:LevelCount := 2
var_Items := oDCOCX_Exontrol1:Items
	h1 := var_Items:AddItem("Task 1")
	var_Items:AddBar(h1,"Task",SToD("20060926"),SToD("20060929"),"A","not resizable")
	var_Items:[ItemBar,h1,"A",exBarCanResize] := false
oDCOCX_Exontrol1:EndUpdate()
|
|
1211
|
How do I specify the day's duration to be at least a specified length
local var_Chart as IChart
local var_Items as IItems
local h1 as USUAL

oDCOCX_Exontrol1:BeginUpdate()
oDCOCX_Exontrol1:Columns:Add("Tasks")
var_Chart := oDCOCX_Exontrol1:Chart
	var_Chart:FirstVisibleDate := SToD("20060920")
	var_Chart:[PaneWidth,false] := 48
	var_Chart:LevelCount := 2
var_Items := oDCOCX_Exontrol1:Items
	h1 := var_Items:AddItem("Task 1")
	var_Items:AddBar(h1,"Task",SToD("20060926"),SToD("20060929"),"A","> 2 Days")
	var_Items:[ItemBar,h1,"A",exBarMinDuration] := 2
oDCOCX_Exontrol1:EndUpdate()
|
|
1210
|
How do I specify the day's duration to be maximum a specified length
local var_Chart as IChart
local var_Items as IItems
local h1 as USUAL

oDCOCX_Exontrol1:BeginUpdate()
oDCOCX_Exontrol1:Columns:Add("Tasks")
var_Chart := oDCOCX_Exontrol1:Chart
	var_Chart:FirstVisibleDate := SToD("20060920")
	var_Chart:[PaneWidth,false] := 48
	var_Chart:LevelCount := 2
var_Items := oDCOCX_Exontrol1:Items
	h1 := var_Items:AddItem("Task 1")
	var_Items:AddBar(h1,"Task",SToD("20060926"),SToD("20060929"),"A","< 3 Days")
	var_Items:[ItemBar,h1,"A",exBarMaxDuration] := 3
oDCOCX_Exontrol1:EndUpdate()
|
|
1209
|
I am trying to construct a timeline that is not date specific. My timeline starts at T=00:00:00 and then increases by 5 seconds. Is it possible
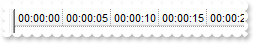
local var_Chart as IChart
local var_Level as ILevel

var_Chart := oDCOCX_Exontrol1:Chart
	var_Chart:[PaneWidth,false] := 0
	var_Chart:FirstVisibleDate := 0
	var_Chart:UnitWidth := 48
	var_Chart:NonworkingDays := 0
	var_Level := var_Chart:[Level,0]
		var_Level:Label := "<%hh%>:<%nn%>:<%ss%>"
		var_Level:Unit := exSecond
		var_Level:Count := 5
|
|
1208
|
How can I specify the levels using the user's Regional and Language Options
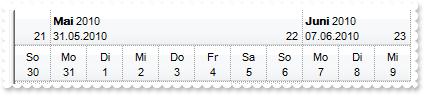
local var_Chart as IChart
local var_Level,var_Level1 as ILevel

oDCOCX_Exontrol1:BeginUpdate()
oDCOCX_Exontrol1:Font:Name := "Arial Unicode MS"
oDCOCX_Exontrol1:HeaderHeight := 36
var_Chart := oDCOCX_Exontrol1:Chart
	var_Chart:FirstVisibleDate := SToD("20100530")
	var_Chart:[PaneWidth,false] := 0
	var_Chart:FirstWeekDay := exMonday
	var_Chart:UnitWidth := 36
	var_Chart:LevelCount := 2
	var_Level := var_Chart:[Level,0]
		var_Level:Label := "<b><%loc_mmmm%></b> <%yyyy%><br><%loc_sdate%><r> <%ww%> "
		var_Level:ToolTip := var_Level:Label
		var_Level:Unit := exWeek
	var_Level1 := var_Chart:[Level,1]
		var_Level1:Label := "<%loc_ddd%><br><%d%>"
		var_Level1:ToolTip := var_Level1:Label
	var_Chart:ToolTip := "<%loc_ldate%>"
oDCOCX_Exontrol1:EndUpdate()
|
|
1207
|
How do I arrange, format or layout the item on multiple levels or lines, as a subform
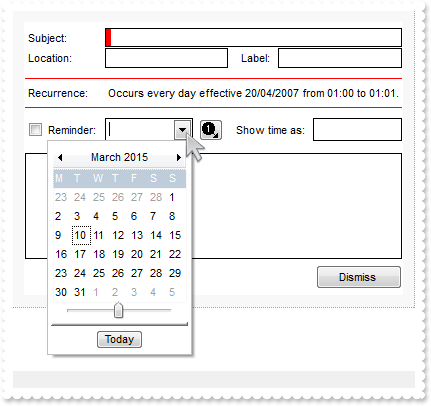
local var_Column,var_Column1,var_Column2,var_Column3,var_Column4,var_Column5,var_Column6 as IColumn
local var_Columns as IColumns
local var_Editor as IEditor
local var_Items as IItems
local h0 as USUAL

oDCOCX_Exontrol1:BeginUpdate()
oDCOCX_Exontrol1:Chart:[PaneWidth,true] := 0
oDCOCX_Exontrol1:Images("gBJJgBAIDAAGAAEAAQhYAf8Pf4hh0QihCJo2AEZjQAjEZFEaIEaEEaAIAkcbk0olUrlktl0vmExmUzmk1m03nE5nU7nk9n0/oFBoVDolFo1HpFJpVLplNp1PqFRqVTqlVq1XrFZrVbrldr1fsFhsVjslls1ntFptVrtltt1vuFxuVzul1u13vF5vV7vl9v1/wGBwWDwmFw2HxGJxWLxmNx0xiFdyOTh8Tf9ZymXx+QytcyNgz8r0OblWjyWds+m0ka1Vf1ta1+r1mos2xrG2xeZ0+a0W0qOx3GO4NV3WeyvD2XJ5XL5nN51aiw+lfSj0gkUkAEllHanHI5j/cHg8EZf7w8vl8j4f/qfEZeB09/vjLAB30+kZQAP/P5/H6/yNAOAEAwCjMBwFAEDwJBMDwLBYAP2/8Hv8/gAGAD8LQs9w/nhDY/oygIA=")
oDCOCX_Exontrol1:DrawGridLines := exRowLines
oDCOCX_Exontrol1:HeaderVisible := exHeaderHidden
oDCOCX_Exontrol1:ItemsAllowSizing := exResizeItem
oDCOCX_Exontrol1:MarkSearchColumn := false
oDCOCX_Exontrol1:ScrollBySingleLine := true
oDCOCX_Exontrol1:BackColor := RGB(255,255,255)
oDCOCX_Exontrol1:SelBackColor := RGB(255,255,255)
oDCOCX_Exontrol1:SelForeColor := 0x80000012
var_Columns := oDCOCX_Exontrol1:Columns
	var_Columns:Add("")
	var_Column := IColumn{var_Columns:Add("Column")}
		var_Column:Visible := false
		var_Column:Editor:EditType := EditType
	var_Column1 := IColumn{var_Columns:Add("Column")}
		var_Column1:Visible := false
		var_Column1:Editor:EditType := DropDownType
	var_Column2 := IColumn{var_Columns:Add("Column")}
		var_Column2:Visible := false
		var_Column2:Editor:EditType := DropDownType
	var_Column3 := IColumn{var_Columns:Add("Column")}
		var_Column3:Visible := false
		var_Editor := var_Column3:Editor
			var_Editor:EditType := CheckValueType
			var_Editor:[Option,exCheckValue2] := 1
	var_Column4 := IColumn{var_Columns:Add("Column")}
		var_Column4:Visible := false
		var_Column4:Editor:EditType := DateType
	IColumn{var_Columns:Add("Column")}:Visible := false
	var_Column5 := IColumn{var_Columns:Add("Column")}
		var_Column5:Visible := false
		var_Column5:Editor:EditType := DropDownType
	var_Column6 := IColumn{var_Columns:Add("Column")}
		var_Column6:Visible := false
		var_Column6:[Def,exCellSingleLine] := 0
		var_Editor := var_Column6:Editor
			var_Editor:EditType := MemoType
			var_Editor:ButtonWidth := 17
			var_Editor:[Option,exDownArrow] := 0
			var_Editor:[Option,exEndKey] := 0
			var_Editor:[Option,exHomeKey] := 0
			var_Editor:[Option,exLeftArrow] := 0
			var_Editor:[Option,exMemoAutoSize] := 0
			var_Editor:[Option,exMemoVScrollBar] := -1
			var_Editor:[Option,exPageDownKey] := 0
			var_Editor:[Option,exPageUpKey] := 0
			var_Editor:[Option,exRightArrow] := 0
			var_Editor:[Option,exUpArrow] := 0
		var_Column6:Visible := false
	IColumn{var_Columns:Add("Column")}:Visible := false
var_Items := oDCOCX_Exontrol1:Items
	h0 := var_Items:AddItem("")
	var_Items:[CellValue,h0,9] := "Dismiss"
	var_Items:[CellFormatLevel,h0,0] := "12;" + CHR(34) + " " + CHR(34) + "[b=0][bg=RGB(248,248,248)]/(" + CHR(34) + " " + CHR(34) + "[b=0][bg=RGB(248,248,248)]:12,(1;" + CHR(34) + " " + CHR(34) + "[b=0]/(" + CHR(34) + " " + CHR(34) + "[b=0]:1,(25;(5;" + CHR(34) + " " + CHR(34) + "[b=0]/((" + CHR(34) + "Subject:" + CHR(34) + "[b=0]:80,(1;" + CHR(34) + " " + CHR(34) + "[b=0][bg=RGB(0,0,0)]/(" + CHR(34) + " " + CHR(34) + "[b=0][bg=RGB(0,0,0)]:1,(" + CHR(34) + " " + CHR(34) + "[b=0][bg=RGB(255,0,0)]:5,1[b=0])," + CHR(34) + " " + CHR(34) + "[b=0][bg=RGB(0,0,0)]:1)/1;" + CHR(34) + " " + CHR(34) + "[b=0][bg=RGB(0,0,0)]))/1;" + CHR(34) + " " + CHR(34) + "[b=0]))/20;(" + CHR(34) + "Location:" + CHR(34) + "[b=0]:80,(1;" + CHR(34) + " " + CHR(34) + "[b=0][bg=RGB(0,0,0)]/(" + CHR(34) + " " + CHR(34) + "[b=0][bg=RGB(0,0,0)]:1,2[b=0]," + CHR(34) + " " + CHR(34) + "[b=0][bg=RGB(0,0,0)]:1)/1;" + CHR(34) + " " + CHR(34) + "[b=0][bg=RGB(0,0,0)]),((" + CHR(34) + " " + CHR(34) + "[b=0]:10," + CHR(34) + "Label:" + CHR(34) + "[b=0])):50,(1;" + CHR(34) + " " + CHR(34) + "[b=0][bg=RGB(0,0,0)]/(" + CHR(34) + " " + CHR(34) + "[b=0][bg=RGB(0,0,0)]:1,3[b=0]," + CHR(34) + " " + CHR(34) + "[b=0][bg=RGB(0,0,0)]:1)/1;" + CHR(34) + " " + CHR(34) + "[b=0][bg=RGB(0,0,0)]))/50;(10;" + CHR(34) + " " + CHR(34) + "[b=0]/(1;" + CHR(34) + " " + CHR(34) + "[b=0][bg=RGB(255,0,0)]/(" + CHR(34) + "Recurrence:" + CHR(34) + "[b=0]:80," + CHR(34) + "Occurs every day effective 20/04/2007 from 01:00 to 01:01." + CHR(34) + "[b=0])/1;" + CHR(34) + " " + CHR(34) + "[b=0][bg=RGB(255,0,0)])/10;" + CHR(34) + " " + CHR(34) + "[b=0])/23;(4[b=0]:20," + CHR(34) + "Reminder:" + CHR(34) + "[b=0]:60,(1;" + CHR(34) + " " + CHR(34) + "[b=0][bg=RGB(0,0,0)]/(" + CHR(34) + " " + CHR(34) + "[b=0][bg=RGB(0,0,0)]:1,5[b=0]," + CHR(34) + " " + CHR(34) + "[b=0][bg=RGB(0,0,0)]:1)/1;" + CHR(34) + " " + CHR(34) + "[b=0][bg=RGB(0,0,0)]),((" + CHR(34) + " " + CHR(34) + "[b=0]:5,6[b=0])):30,((" + CHR(34) + " " + CHR(34) + "[b=0]:10," + CHR(34) + "Show time as:" + CHR(34) + "[b=0])):90,(1;" + CHR(34) + " " + CHR(34) + "[b=0][bg=RGB(0,0,0)]/(" + CHR(34) + " " + CHR(34) + "[b=0][bg=RGB(0,0,0)]:1,7[b=0]," + CHR(34) + " " + CHR(34) + "[b=0][bg=RGB(0,0,0)]:1)/1;" + CHR(34) + " " + CHR(34) + "[b=0][bg=RGB(0,0,0)]))/(12;" + CHR(34) + " " + CHR(34) + "[b=0]/(1;" + CHR(34) + " " + CHR(34) + "[b=0][bg=RGB(0,0,0)]/(" + CHR(34) + " " + CHR(34) + "[b=0][bg=RGB(0,0,0)]:1,8[b=0]," + CHR(34) + " " + CHR(34) + "[b=0][bg=RGB(0,0,0)]:1)/1;" + CHR(34) + " " + CHR(34) + "[b=0][bg=RGB(0,0,0)]))/35;(5;" + CHR(34) + " " + CHR(34) + "[b=0]/(" + CHR(34) + " " + CHR(34) + "[b=0]," + CHR(34) + " " + CHR(34) + "[b=0],((" + CHR(34) + " " + CHR(34) + "[b=0]:40,9[b=0])))/5;" + CHR(34) + " " + CHR(34) + "[b=0]))," + CHR(34) + " " + CHR(34) + "[b=0]:1)/1;" + CHR(34) + " " + CHR(34) + "[b=0])," + CHR(34) + " " + CHR(34) + "[b=0][bg=RGB(248,248,248)]:12)/12;" + CHR(34) + " " + CHR(34) + "[b=0][bg=RGB(248,248,248)]"
	var_Items:[CellHasCheckBox,h0,4] := true
	var_Items:[CellHasButton,h0,9] := true
	var_Items:[CellHAlignment,h0,9] := CenterAlignment
	var_Items:[CellVAlignment,h0,8] := exTop
	var_Items:[CellForeColor,h0,8] := RGB(0,0,0)
	var_Items:[CellHasButton,h0,6] := true
	var_Items:[CellValue,h0,6] := "<img>1</img>"
	var_Items:[CellValueFormat,h0,6] := exHTML
	var_Items:[CellHAlignment,h0,6] := CenterAlignment
	var_Items:[ItemHeight,h0] := 296
oDCOCX_Exontrol1:EndUpdate()
|
|
1206
|
How can I arrange the columns on multiple levels
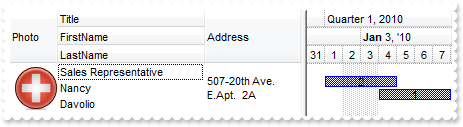
local var_Column,var_Column1 as IColumn
local var_Columns as IColumns
local var_Items as IItems
local h as USUAL

oDCOCX_Exontrol1:BeginUpdate()
oDCOCX_Exontrol1:DefaultItemHeight := 48
var_Columns := oDCOCX_Exontrol1:Columns
	IColumn{var_Columns:Add("Title")}:Visible := false
	IColumn{var_Columns:Add("FirstName")}:Visible := false
	IColumn{var_Columns:Add("LastName")}:Visible := false
	IColumn{var_Columns:Add("Photo")}:Visible := false
	var_Column := IColumn{var_Columns:Add("Address")}
		var_Column:Visible := false
		var_Column:[Def,exCellSingleLine] := false
	var_Column1 := IColumn{var_Columns:Add("Personal Info")}
		var_Column1:FormatLevel := "3:48,(0/1/2),4:96"
		var_Column1:[Def,exCellFormatLevel] := "3:48,(0/1/2),4:96"
oDCOCX_Exontrol1:Chart:FirstVisibleDate := SToD("20100101")
oDCOCX_Exontrol1:Chart:Bars:[Item,"Task"]:OverlaidType := exOverlaidBarsStackAutoArrange | exOverlaidBarsStack
var_Items := oDCOCX_Exontrol1:Items
	h := var_Items:AddItem("Sales Representative")
	var_Items:[CellValue,h,1] := "Nancy"
	var_Items:[CellValue,h,2] := "Davolio"
	// Generate Source for 'OLE Automation(stdole2.tlb)' server from Tools\Automation Server... with the PREFIX std
	var_Items:[CellPicture,h,3] := oDCOCX_Exontrol1:ExecuteTemplate("loadpicture(`c:\exontrol\images\zipdisk.gif`)")
	var_Items:[CellValue,h,4] := "507-20th Ave. E.Apt.  2A"
	var_Items:AddBar(h,"Task",SToD("20100101"),SToD("20100105"),2,2)
	var_Items:AddBar(h,"Task",SToD("20100104"),SToD("20100108"),1,1)
oDCOCX_Exontrol1:EndUpdate()
|
|
1205
|
Is it possible to display a bar only using a gradient color using the exBarColor option
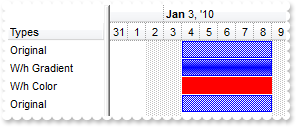
local var_Bar as IBar
local var_Chart as IChart
local var_Items as IItems
local h as USUAL

oDCOCX_Exontrol1:BeginUpdate()
var_Chart := oDCOCX_Exontrol1:Chart
	var_Chart:FirstVisibleDate := SToD("20091231")
	var_Chart:LevelCount := 2
	var_Chart:[PaneWidth,false] := 96
	var_Bar := var_Chart:Bars:[Item,"Task"]
		var_Bar:StartColor := RGB(255,255,255)
		var_Bar:EndColor := var_Bar:StartColor
		var_Bar:Height := 17
oDCOCX_Exontrol1:Columns:Add("Types")
var_Items := oDCOCX_Exontrol1:Items
	var_Items:AddBar(var_Items:AddItem("Original"),"Task",SToD("20100104"),SToD("20100109"),"",nil)
	h := var_Items:AddItem("W/h Gradient")
	var_Items:AddBar(h,"Task",SToD("20100104"),SToD("20100109"),"",nil)
	var_Items:[ItemBar,h,"",exBarPattern] := 227
	h := var_Items:AddItem("W/h Color")
	var_Items:AddBar(h,"Task",SToD("20100104"),SToD("20100109"),"",nil)
	var_Items:[ItemBar,h,"",exBarPattern] := 227
	var_Items:[ItemBar,h,"",exBarColor] := 255
	var_Items:AddBar(var_Items:AddItem("Original"),"Task",SToD("20100104"),SToD("20100109"),"",nil)
oDCOCX_Exontrol1:EndUpdate()
|
|
1204
|
Is it possible to display a bar only using a gradient color
local var_Bar as IBar
local var_Chart as IChart
local var_Items as IItems
local h as USUAL

oDCOCX_Exontrol1:BeginUpdate()
var_Chart := oDCOCX_Exontrol1:Chart
	var_Chart:FirstVisibleDate := SToD("20091231")
	var_Chart:LevelCount := 2
	var_Chart:[PaneWidth,false] := 96
	var_Bar := var_Chart:Bars:[Item,"Task"]
		var_Bar:StartColor := RGB(255,255,255)
		var_Bar:EndColor := var_Bar:StartColor
		var_Bar:Height := 17
oDCOCX_Exontrol1:Columns:Add("Types")
var_Items := oDCOCX_Exontrol1:Items
	var_Items:AddBar(var_Items:AddItem("Original"),"Task",SToD("20100104"),SToD("20100109"),"",nil)
	h := var_Items:AddItem("W/h Gradient")
	var_Items:AddBar(h,"Task",SToD("20100104"),SToD("20100109"),"",nil)
	var_Items:[ItemBar,h,"",exBarPattern] := 227
	var_Items:AddBar(var_Items:AddItem("Original"),"Task",SToD("20100104"),SToD("20100109"),"",nil)
oDCOCX_Exontrol1:EndUpdate()
|
|
1203
|
Is it possible to display a bar only using a gradient color
local var_Bar as IBar
local var_Chart as IChart
local var_Items as IItems
local h as USUAL

oDCOCX_Exontrol1:BeginUpdate()
var_Chart := oDCOCX_Exontrol1:Chart
	var_Chart:FirstVisibleDate := SToD("20091231")
	var_Chart:LevelCount := 2
	var_Chart:[PaneWidth,false] := 96
	var_Bar := var_Chart:Bars:[Item,"Task"]
		var_Bar:StartColor := RGB(255,255,255)
		var_Bar:EndColor := var_Bar:Color
oDCOCX_Exontrol1:Columns:Add("Types")
var_Items := oDCOCX_Exontrol1:Items
	var_Items:AddBar(var_Items:AddItem("Original"),"Task",SToD("20100104"),SToD("20100109"),"",nil)
	h := var_Items:AddItem("W/h Gradient")
	var_Items:AddBar(h,"Task",SToD("20100104"),SToD("20100109"),"",nil)
	var_Items:[ItemBar,h,"",exBarPattern] := 99
	var_Items:AddBar(var_Items:AddItem("Original"),"Task",SToD("20100104"),SToD("20100109"),"",nil)
oDCOCX_Exontrol1:EndUpdate()
|
|
1202
|
How can I display a specified bar only with a thicker border
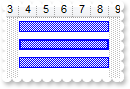
local var_Chart as IChart
local var_Items as IItems
local h as USUAL

oDCOCX_Exontrol1:BeginUpdate()
var_Chart := oDCOCX_Exontrol1:Chart
	var_Chart:FirstVisibleDate := SToD("20091231")
	var_Chart:LevelCount := 2
	var_Chart:[PaneWidth,false] := 96
oDCOCX_Exontrol1:Columns:Add("Types")
var_Items := oDCOCX_Exontrol1:Items
	var_Items:AddBar(var_Items:AddItem("Original"),"Task",SToD("20100104"),SToD("20100109"),"",nil)
	h := var_Items:AddItem("W/h Border")
	var_Items:AddBar(h,"Task",SToD("20100104"),SToD("20100109"),"",nil)
	var_Items:[ItemBar,h,"",exBarPattern] := 4099
	var_Items:AddBar(var_Items:AddItem("Original"),"Task",SToD("20100104"),SToD("20100109"),"",nil)
oDCOCX_Exontrol1:EndUpdate()
|
|
1201
|
Is it possible to display the shadow for a specified bar
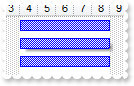
local var_Chart as IChart
local var_Items as IItems
local h as USUAL

oDCOCX_Exontrol1:BeginUpdate()
var_Chart := oDCOCX_Exontrol1:Chart
	var_Chart:FirstVisibleDate := SToD("20091231")
	var_Chart:LevelCount := 2
	var_Chart:[PaneWidth,false] := 96
oDCOCX_Exontrol1:Columns:Add("Types")
var_Items := oDCOCX_Exontrol1:Items
	var_Items:AddBar(var_Items:AddItem("Original"),"Task",SToD("20100104"),SToD("20100109"),"",nil)
	h := var_Items:AddItem("W/h Shadow")
	var_Items:AddBar(h,"Task",SToD("20100104"),SToD("20100109"),"",nil)
	var_Items:[ItemBar,h,"",exBarPattern] := 8195
	var_Items:AddBar(var_Items:AddItem("Original"),"Task",SToD("20100104"),SToD("20100109"),"",nil)
oDCOCX_Exontrol1:EndUpdate()
|